A Graph Signal Processing View on Functional Brain Imaging
Publication
Metrics
AI Quick Summary
This paper reviews the application of graph signal processing (GSP) to functional brain imaging, highlighting how GSP can integrate brain structure and function. It discusses how GSP can analyze brain activity through spectral modes derived from structural graphs and offers novel operations for cognitive systems analysis.
Paper Preview
Abstract
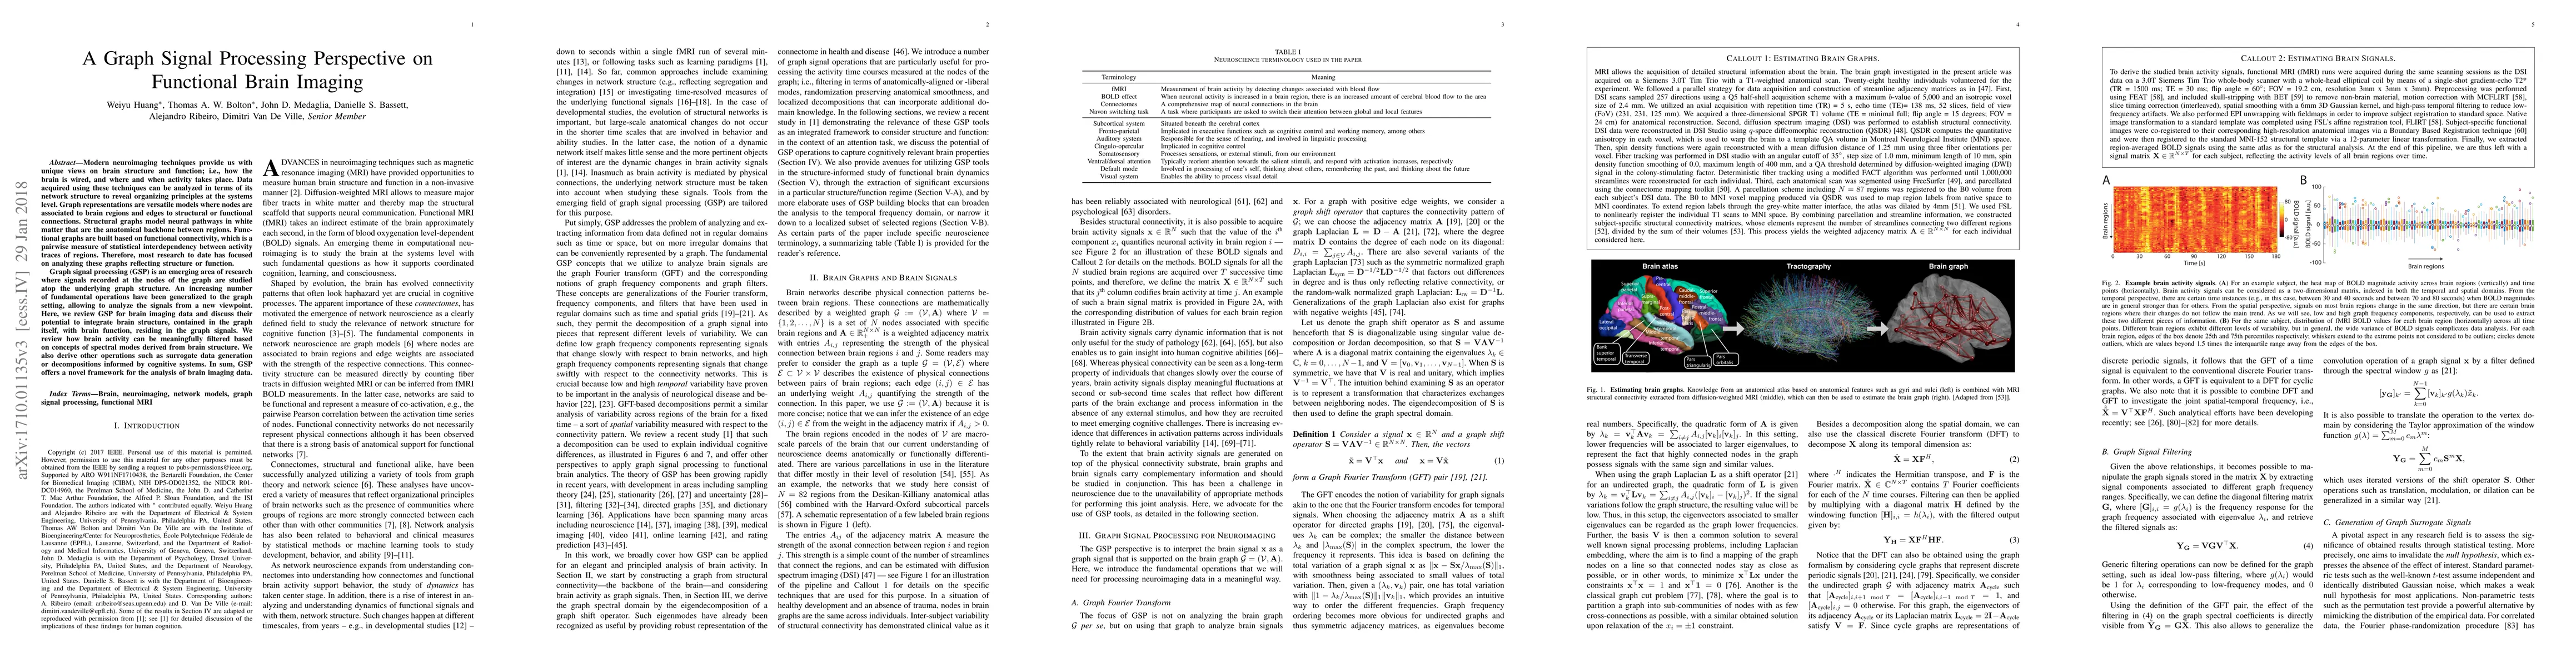
Modern neuroimaging techniques provide us with unique views on brain structure and function; i.e., how the brain is wired, and where and when activity takes place. Data acquired using these techniques can be analyzed in terms of its network structure to reveal organizing principles at the systems level. Graph representations are versatile models where nodes are associated to brain regions and edges to structural or functional connections. Structural graphs model neural pathways in white matter that are the anatomical backbone between regions. Functional graphs are built based on functional connectivity, which is a pairwise measure of statistical interdependency between activity traces of regions. Therefore, most research to date has focused on analyzing these graphs reflecting structure or function. Graph signal processing (GSP) is an emerging area of research where signals recorded at the nodes of the graph are studied atop the underlying graph structure. An increasing number of fundamental operations have been generalized to the graph setting, allowing to analyze the signals from a new viewpoint. Here, we review GSP for brain imaging data and discuss their potential to integrate brain structure, contained in the graph itself, with brain function, residing in the graph signals. We review how brain activity can be meaningfully filtered based on concepts of spectral modes derived from brain structure. We also derive other operations such as surrogate data generation or decompositions informed by cognitive systems. In sum, GSP offers a novel framework for the analysis of brain imaging data.
AI Key Findings
Get AI-generated insights about this paper's methodology, results, significance, and more — seven facets brought into focus.
Impact
Paper Details
PDF Preview
Key Terms
Citation Network
Current paper (gray), citations (green), references (blue)
Display is limited for performance on very large graphs.
Discussion 0