Background
The paper builds on foundational ideas in decision analysis and probabilistic graphical models. It formalizes influence diagrams as graphical representations of decision problems, with chance nodes (uncertainties), decision nodes (choices), a value node (utility), and directed arcs encoding dependencies. The Expected Value of Perfect Information (EVPI) and its net variant (NEVPI) are central notions: EVPI quantifies how much a decision-maker would be willing to pay for perfect knowledge about an uncertain variable before acting, while NEVPI subtracts the information cost. The work leverages well-known concepts of d-separation, a graphical criterion that determines conditional independence in DAGs, and Howard canonical form, a reformulation technique that avoids problematic dependencies when evaluating information value.
The theoretical backbone rests on a sequence of theorems that relate EVPI to the model’s topology. The first results show when a chance variable X has no value of information relative to a decision node A, particularly when X is not connected to the value node except through the decision. Subsequent theorems establish a qualitative ordering principle: variables that are closer in the graphical topology to the value node generally carry higher EVPI, and the presence of chains of chance nodes creates predictable attenuation of information value with distance. The framework extends naturally to sets of variables and to multiple decision nodes, yielding joint EVPI orderings and corollaries for canonical forms.
Problem / Research Question
The central question is whether one can determine partial or total orderings of EVPI (and NEVPI) values for chance variables solely from the topological structure of a decision model, without performing numerical computations over probabilities and utilities. The authors seek to identify when and how d-separation and the model’s canonical reformulation can reveal informational relevance, and how these qualitative insights can guide both information gathering and model refinement.
Innovation / Contribution
The paper makes several key innovations. First, it provides a formal, topology-based method for ordering EVPI values with respect to a chosen decision node, using a precise procedure to construct an EVPI-ordering graph as a subgraph of the influence diagram. Second, it proves that the value of information generally grows as a chance node’s proximity to the value node increases, and that d-separation can identify which nodes share informational relevance under specified conditions (e.g., non-descendant relationships). Third, it generalizes these ideas to sets of nodes and to joint EVPI values (Theorems 3–5, Corollaries 1–2), enabling partial orderings over multiple variables and multiple decisions. Fourth, it connects these qualitative results to NEVPI, showing that, under equal costs, NEVPI orders align with EVPI, and providing a pathway to compare information-gathering priorities when costs differ.
Methodology / Approach
The authors formalize a decision model as M = (C, D, V, E) and introduce a canonical form with respect to a decision node to ensure well-defined EVPI analyses. They establish a set of results that relate topology to information value: (i) a zero-EVPI condition when a variable is an ancestor of the decision and not connected to the value node; (ii) a proximity-based ordering in chain structures; (iii) a general framework using d-separation to order variables relative to the value node, provided certain non-descendant conditions hold and the model is canonically formulated; (iv) a constructive procedure to create a partial ordering graph by connecting nodes that are not d-separated by the value node, thereby producing a directed graph whose edges reflect EVPI hierarchy. The approach also handles sets of variables (joint EVPI) and extensions to multiple decision nodes.
Experiments / Evaluation
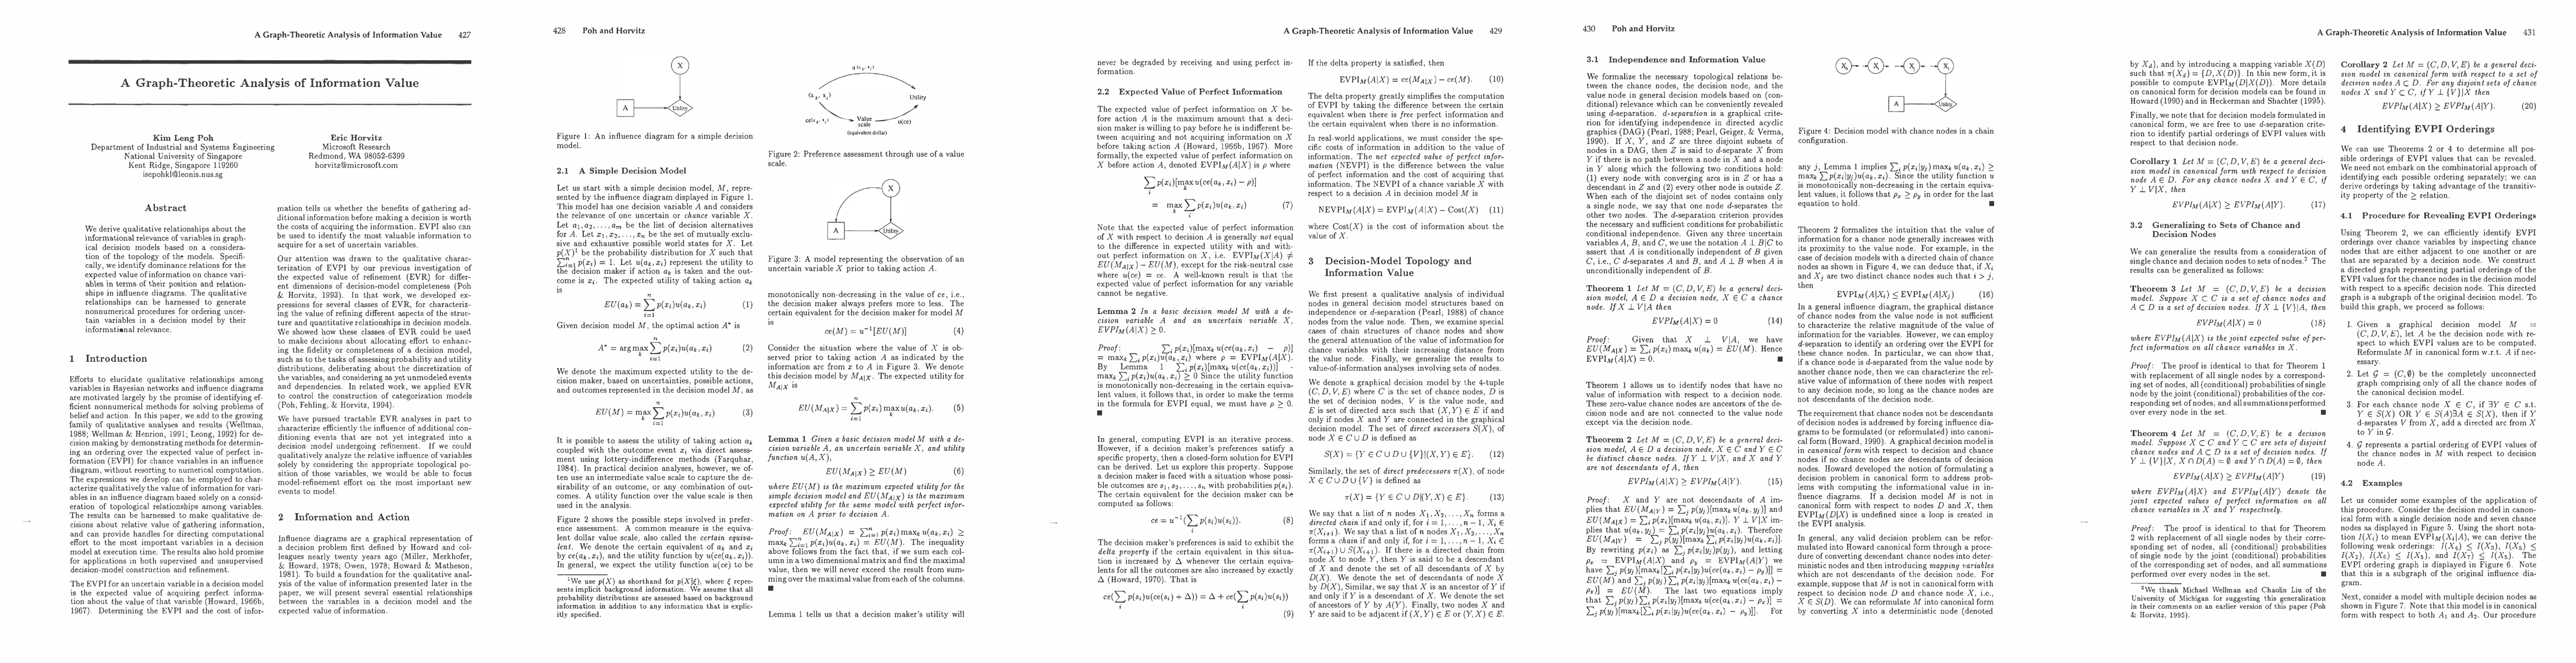
The paper anchors its theoretical claims with illustrative examples embedded in figures (e.g., a single-decision canonical form with seven chance nodes, and more complex models with multiple decisions). It demonstrates concrete EVPI orderings such as I(X4) being less than I(X3), and I(X7) less than I(X5) in a particular canonical model, and shows how the ordering graph (a subgraph of the original diagram) encodes these qualitative relations. Additional examples with multiple decision nodes illustrate separate orderings for each decision node, and a case where a particular EVPI value is zero because of network structure. While these are qualitative demonstrations rather than numerical experiments, they validate the method’s ability to extract meaningful hierarchies from topology alone. The discussion also notes that exact numerical EVPI values or tight bounds may still require targeted quantitative analysis when the topology cannot fully determine the ordering.
Key Results
The principal results can be summarized as follows: (1) EVPI and NEVPI can be ordered qualitatively using topological properties of the decision model, particularly proximity to the value node and d-separation relations. (2) A canonical reformulation permits safe, unambiguous EVPI analysis by removing problematic dependencies from descendant chance nodes. (3) A practical four-step procedure enables building an EVPI ordering graph that captures partial orderings without enumerating all EVPI values. (4) Theorems extend the single-variable results to sets of variables and to multiple decision nodes, yielding joint EVPI orderings and enabling comparisons across variables under varying costs (NEVPI). (5) The framework supports real-world applications in model refinement, data gathering decisions, and decision-support systems by providing a topological compass for where better information will be most valuable.
Practical Applications
The qualitative EVPI analysis offers a lightweight, structure-driven tool for decision analysts and intelligent systems. In information-gathering phases, practitioners can use the ordering graph to prioritize which uncertainties to resolve first, potentially saving computational resources and time. In model refinement, the topology-guided priorities help focus efforts on the most influential variables and relationships, improving the fidelity of the decision model where it matters most. The results are also relevant for automated construction and refinement of decision models, enabling scheduling of data collection and experimentation in time-critical settings (e.g., medical decision aids, diagnostic systems, and real-time planning). The NEVPI extension provides a principled way to incorporate varying information costs into the prioritization scheme.
Limitations & Considerations
The approach yields partial rather than complete orderings in many cases; a total EVPI or NEVPI ranking may still require quantitative analysis. The method relies on canonical form with respect to the decision node and on d-separation to reveal independencies; constructing canonical form and verifying d-separation can be nontrivial for very large or cyclically complex models. The delta-property-based closed-form EVPI simplifications are described as special-case conditions and may not hold universally for all utility structures, particularly with non-linear or non-monotone utilities. While the framework provides bounds and efficient prioritization, practitioners should still perform targeted numerical checks when precise EVPI values or tight NEVPI bounds are essential. Finally, extensions to dynamic or time-serial models (temporal influence diagrams) and to more complicated cost structures warrant further study to confirm scalability and robustness in real-world pipelines.
Discussion 0