A graphical exploration of the relationship between parasite aggregation indices
Publication
Metrics
AI Quick Summary
This study employs contour plots to graphically explore the complex relationships between various parasite aggregation indices, mean abundance, and prevalence, demonstrating that correlations do not adequately capture the nonlinear dynamics involved. The analysis emphasizes the importance of visual tools for understanding these intricate ecological measurements.
Paper Preview
Abstract
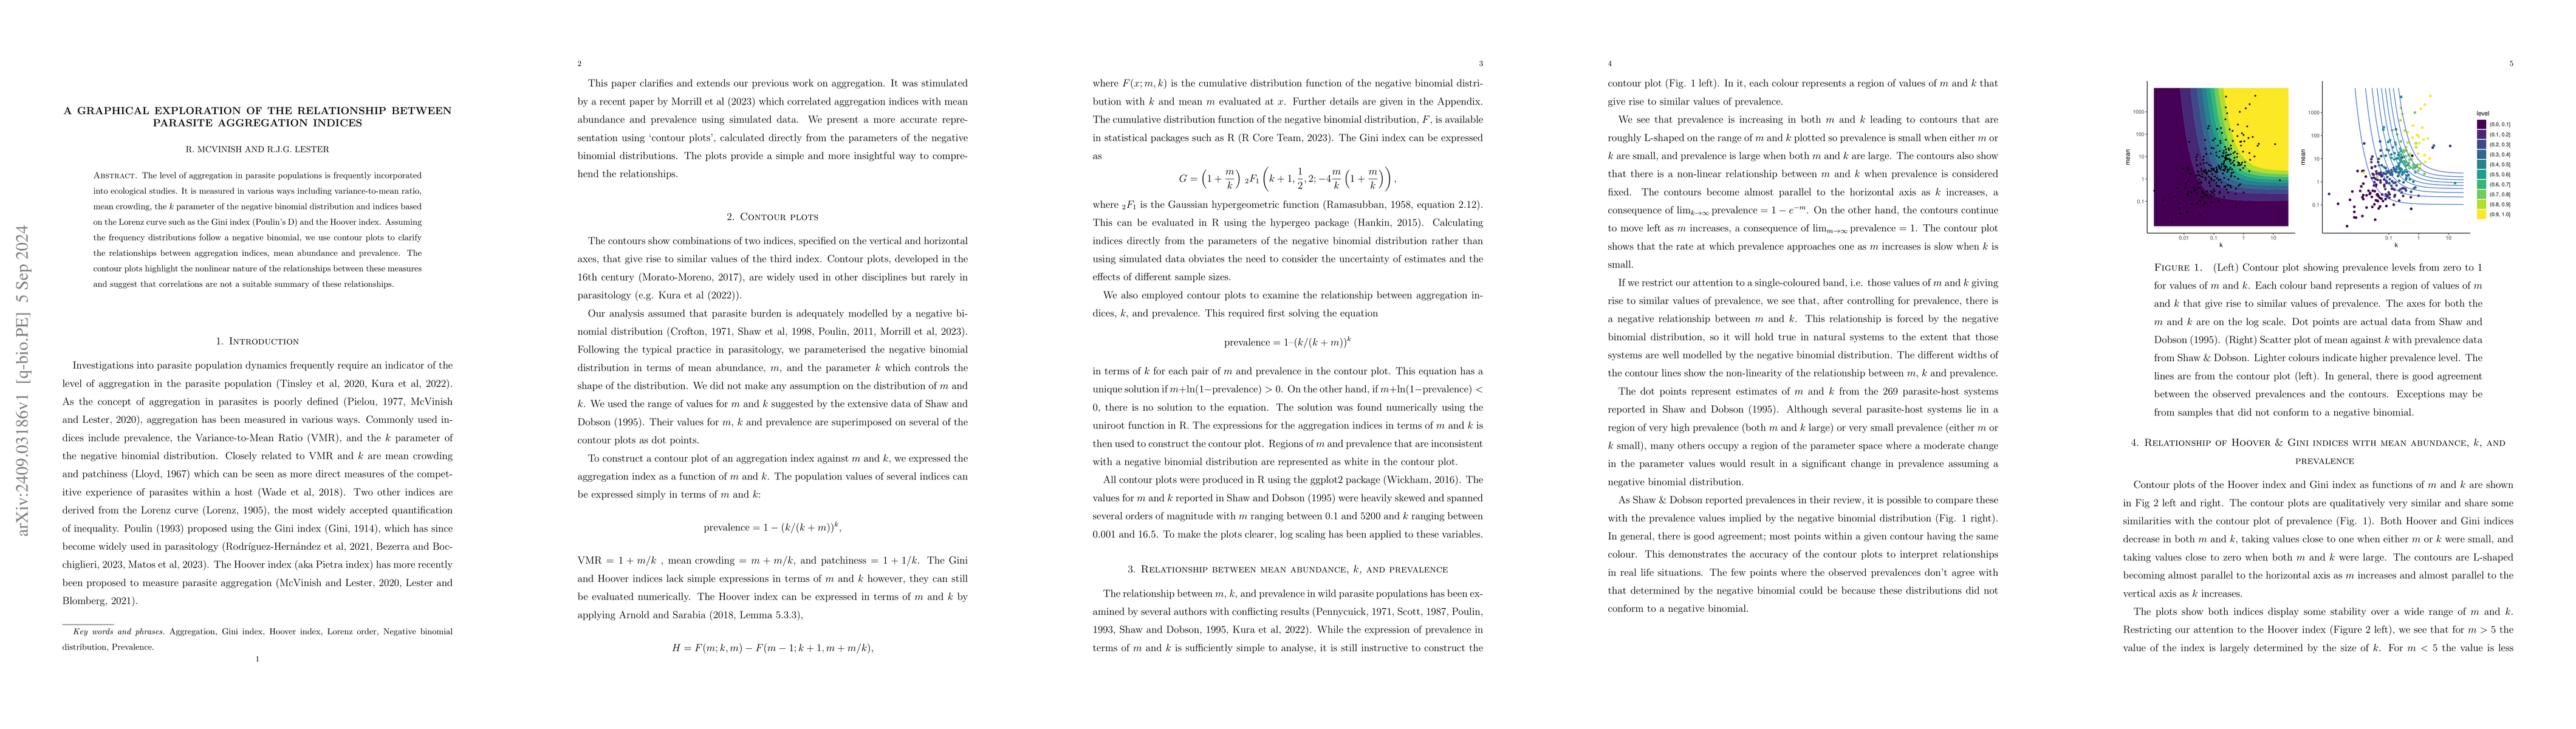
The level of aggregation in parasite populations is frequently incorporated into ecological studies. It is measured in various ways including variance-to-mean ratio, mean crowding, the $k$ parameter of the negative binomial distribution and indices based on the Lorenz curve such as the Gini index (Poulin's D) and the Hoover index. Assuming the frequency distributions follow a negative binomial, we use contour plots to clarify the relationships between aggregation indices, mean abundance and prevalence. The contour plots highlight the nonlinear nature of the relationships between these measures and suggest that correlations are not a suitable summary of these relationships.
AI Key Findings
Get AI-generated insights about this paper's methodology, results, significance, and more — seven facets brought into focus.
Impact
Paper Details
Authors
PDF Preview
Citation Network
Current paper (gray), citations (green), references (blue)
Display is limited for performance on very large graphs.
Discussion 0