A graphical method of cumulative differences between two subpopulations
Publication
Metrics
AI Quick Summary
This paper introduces a graphical method for comparing cumulative differences between two subpopulations, eliminating the need for arbitrary binning of data. It proposes a more precise approach analogous to Kolmogorov-Smirnov statistics to assess the significance of outcome differences between subpopulations, reducing noise from discrete outcomes.
Paper Preview
Abstract
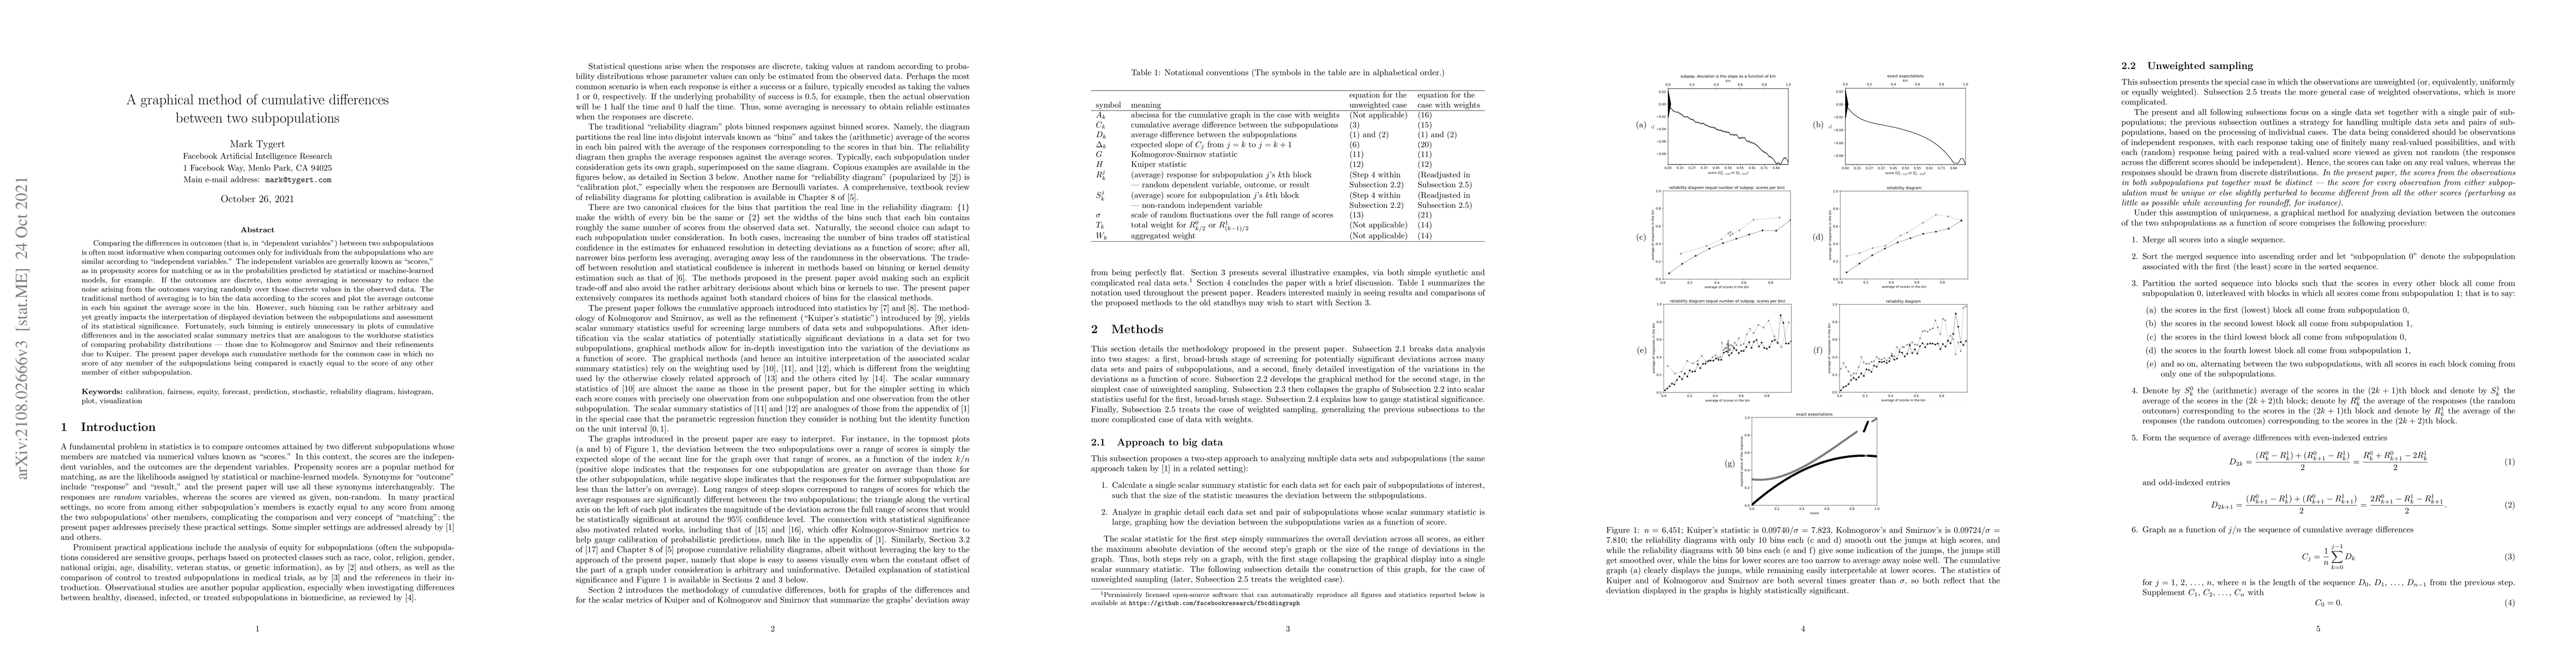
Comparing the differences in outcomes (that is, in "dependent variables") between two subpopulations is often most informative when comparing outcomes only for individuals from the subpopulations who are similar according to "independent variables." The independent variables are generally known as "scores," as in propensity scores for matching or as in the probabilities predicted by statistical or machine-learned models, for example. If the outcomes are discrete, then some averaging is necessary to reduce the noise arising from the outcomes varying randomly over those discrete values in the observed data. The traditional method of averaging is to bin the data according to the scores and plot the average outcome in each bin against the average score in the bin. However, such binning can be rather arbitrary and yet greatly impacts the interpretation of displayed deviation between the subpopulations and assessment of its statistical significance. Fortunately, such binning is entirely unnecessary in plots of cumulative differences and in the associated scalar summary metrics that are analogous to the workhorse statistics of comparing probability distributions -- those due to Kolmogorov and Smirnov and their refinements due to Kuiper. The present paper develops such cumulative methods for the common case in which no score of any member of the subpopulations being compared is exactly equal to the score of any other member of either subpopulation.
AI Key Findings
Get AI-generated insights about this paper's methodology, results, significance, and more — seven facets brought into focus.
Impact
Paper Details
Authors
PDF Preview
Key Terms
Citation Network
Current paper (gray), citations (green), references (blue)
Display is limited for performance on very large graphs.
Discussion 0