Publication
Metrics
AI Quick Summary
This paper proposes a hierarchical model for estimating latent sub-population mean curves from aggregated functional data using Gaussian processes. It explores two covariance specifications and employs Bayesian inference to provide uncertainty estimates and disaggregated curve predictions, demonstrated through applications in NIR spectroscopy and energy distribution analysis.
Paper Preview
Abstract
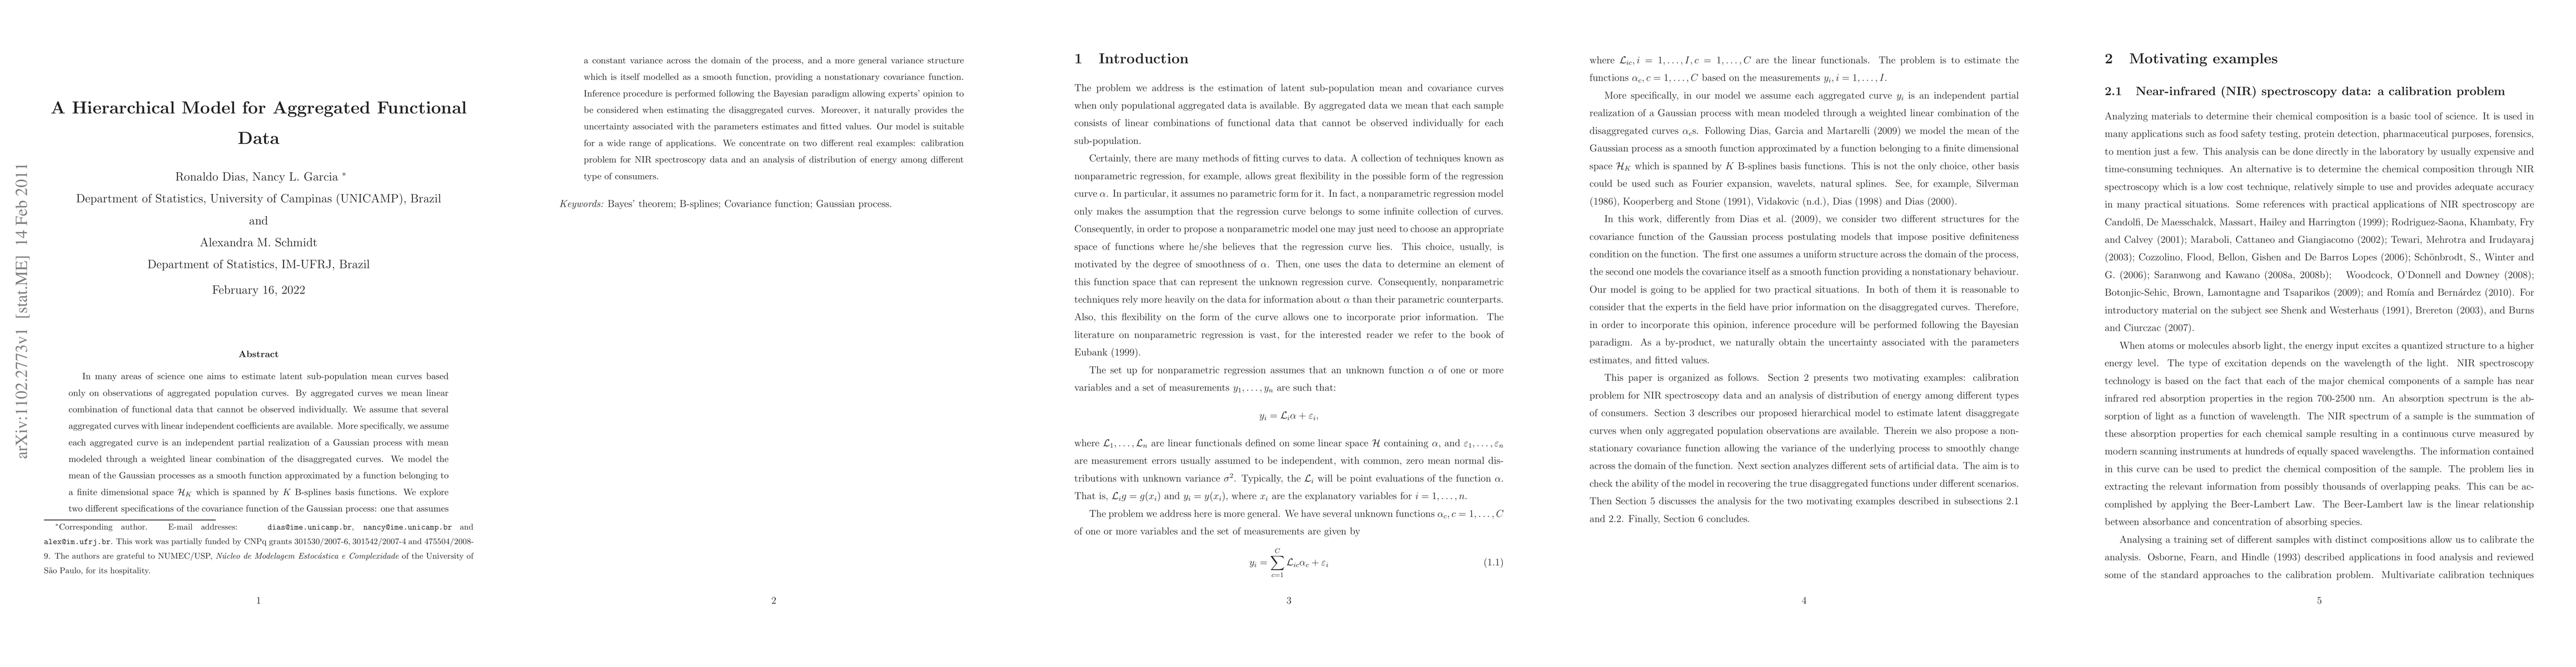
In many areas of science one aims to estimate latent sub-population mean curves based only on observations of aggregated population curves. By aggregated curves we mean linear combination of functional data that cannot be observed individually. We assume that several aggregated curves with linear independent coefficients are available. More specifically, we assume each aggregated curve is an independent partial realization of a Gaussian process with mean modeled through a weighted linear combination of the disaggregated curves. We model the mean of the Gaussian processes as a smooth function approximated by a function belonging to a finite dimensional space ${\cal H}_K$ which is spanned by $K$ B-splines basis functions. We explore two different specifications of the covariance function of the Gaussian process: one that assumes a constant variance across the domain of the process, and a more general variance structure which is itself modelled as a smooth function, providing a nonstationary covariance function. Inference procedure is performed following the Bayesian paradigm allowing experts' opinion to be considered when estimating the disaggregated curves. Moreover, it naturally provides the uncertainty associated with the parameters estimates and fitted values. Our model is suitable for a wide range of applications. We concentrate on two different real examples: calibration problem for NIR spectroscopy data and an analysis of distribution of energy among different type of consumers.
AI Key Findings
Get AI-generated insights about this paper's methodology, results, significance, and more — seven facets brought into focus.
Impact
Paper Details
PDF Preview
Key Terms
Citation Network
Current paper (gray), citations (green), references (blue)
Display is limited for performance on very large graphs.
Discussion 0