A Holistic Approach to Log Data Analysis in High-Performance Computing Systems: The Case of IBM Blue Gene/Q
Publication
Metrics
AI Quick Summary
This paper presents a comprehensive analysis of log data from an IBM Blue Gene/Q system, revealing low correlations in temperature and power but higher event correlations. The study aims to provide a holistic view of the computing infrastructure to inform future predictive models for automated management.
Paper Preview
Abstract
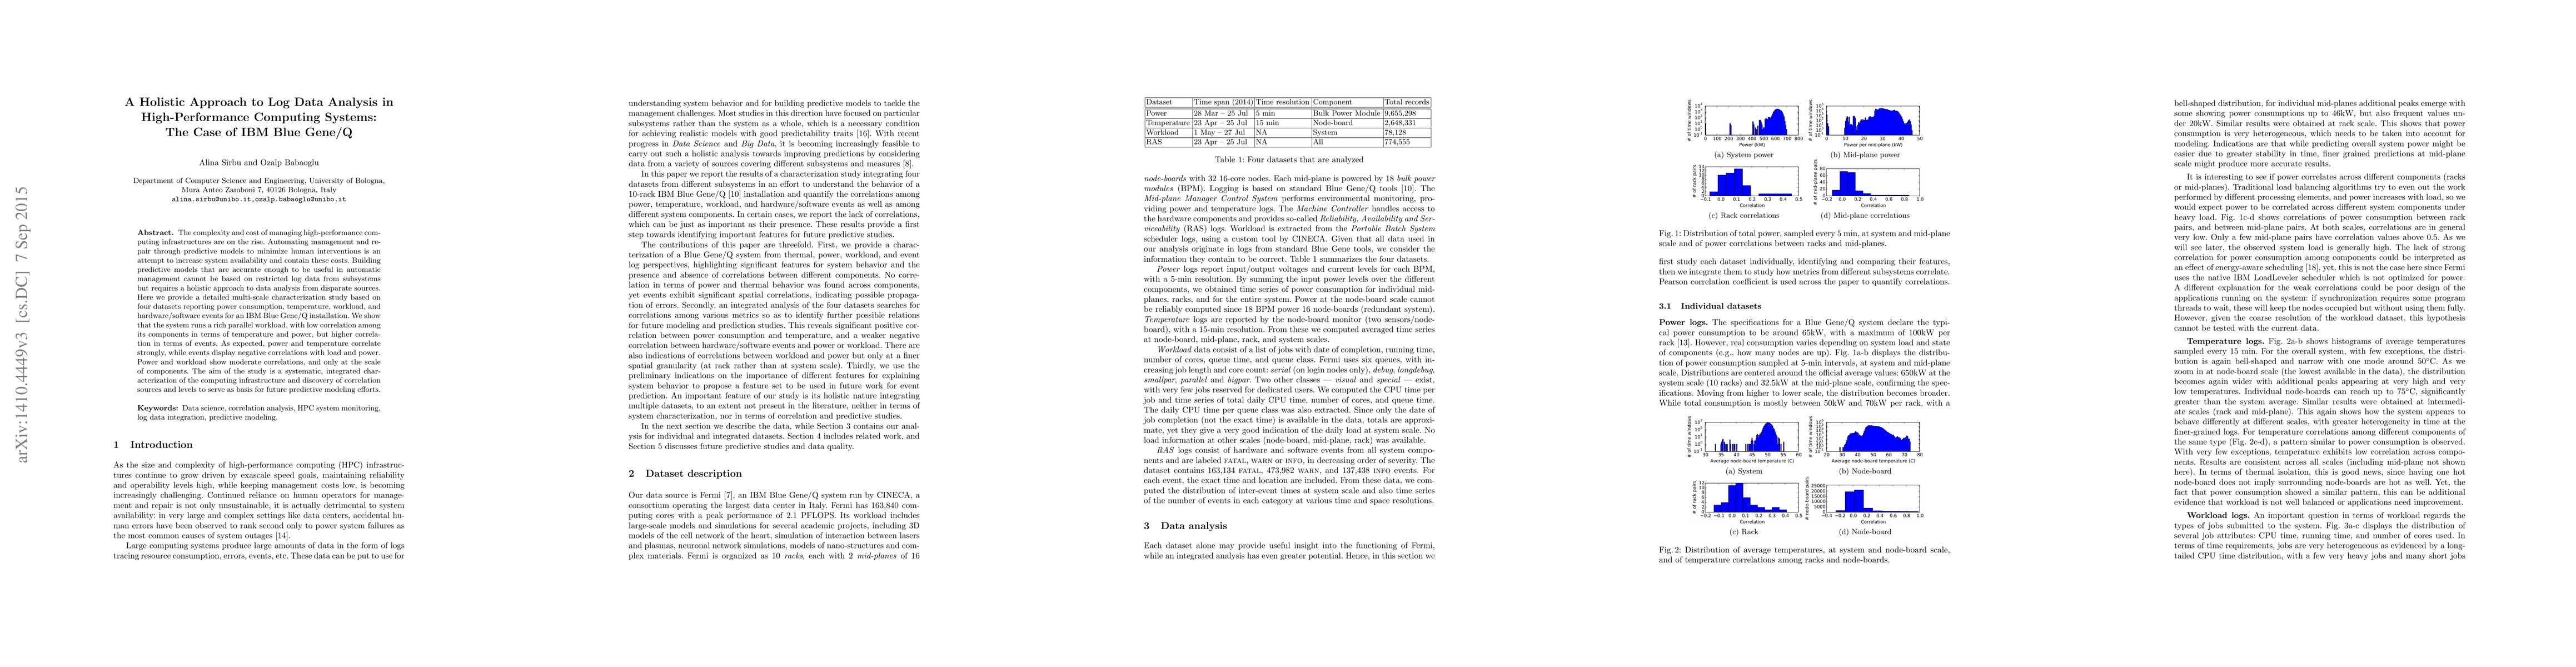
The complexity and cost of managing high-performance computing infrastructures are on the rise. Automating management and repair through predictive models to minimize human interventions is an attempt to increase system availability and contain these costs. Building predictive models that are accurate enough to be useful in automatic management cannot be based on restricted log data from subsystems but requires a holistic approach to data analysis from disparate sources. Here we provide a detailed multi-scale characterization study based on four datasets reporting power consumption, temperature, workload, and hardware/software events for an IBM Blue Gene/Q installation. We show that the system runs a rich parallel workload, with low correlation among its components in terms of temperature and power, but higher correlation in terms of events. As expected, power and temperature correlate strongly, while events display negative correlations with load and power. Power and workload show moderate correlations, and only at the scale of components. The aim of the study is a systematic, integrated characterization of the computing infrastructure and discovery of correlation sources and levels to serve as basis for future predictive modeling efforts.
AI Key Findings
Get AI-generated insights about this paper's methodology, results, significance, and more — seven facets brought into focus.
Impact
Paper Details
PDF Preview
Key Terms
Citation Network
Current paper (gray), citations (green), references (blue)
Display is limited for performance on very large graphs.
Discussion 0