Publication
Metrics
Paper Preview
Abstract
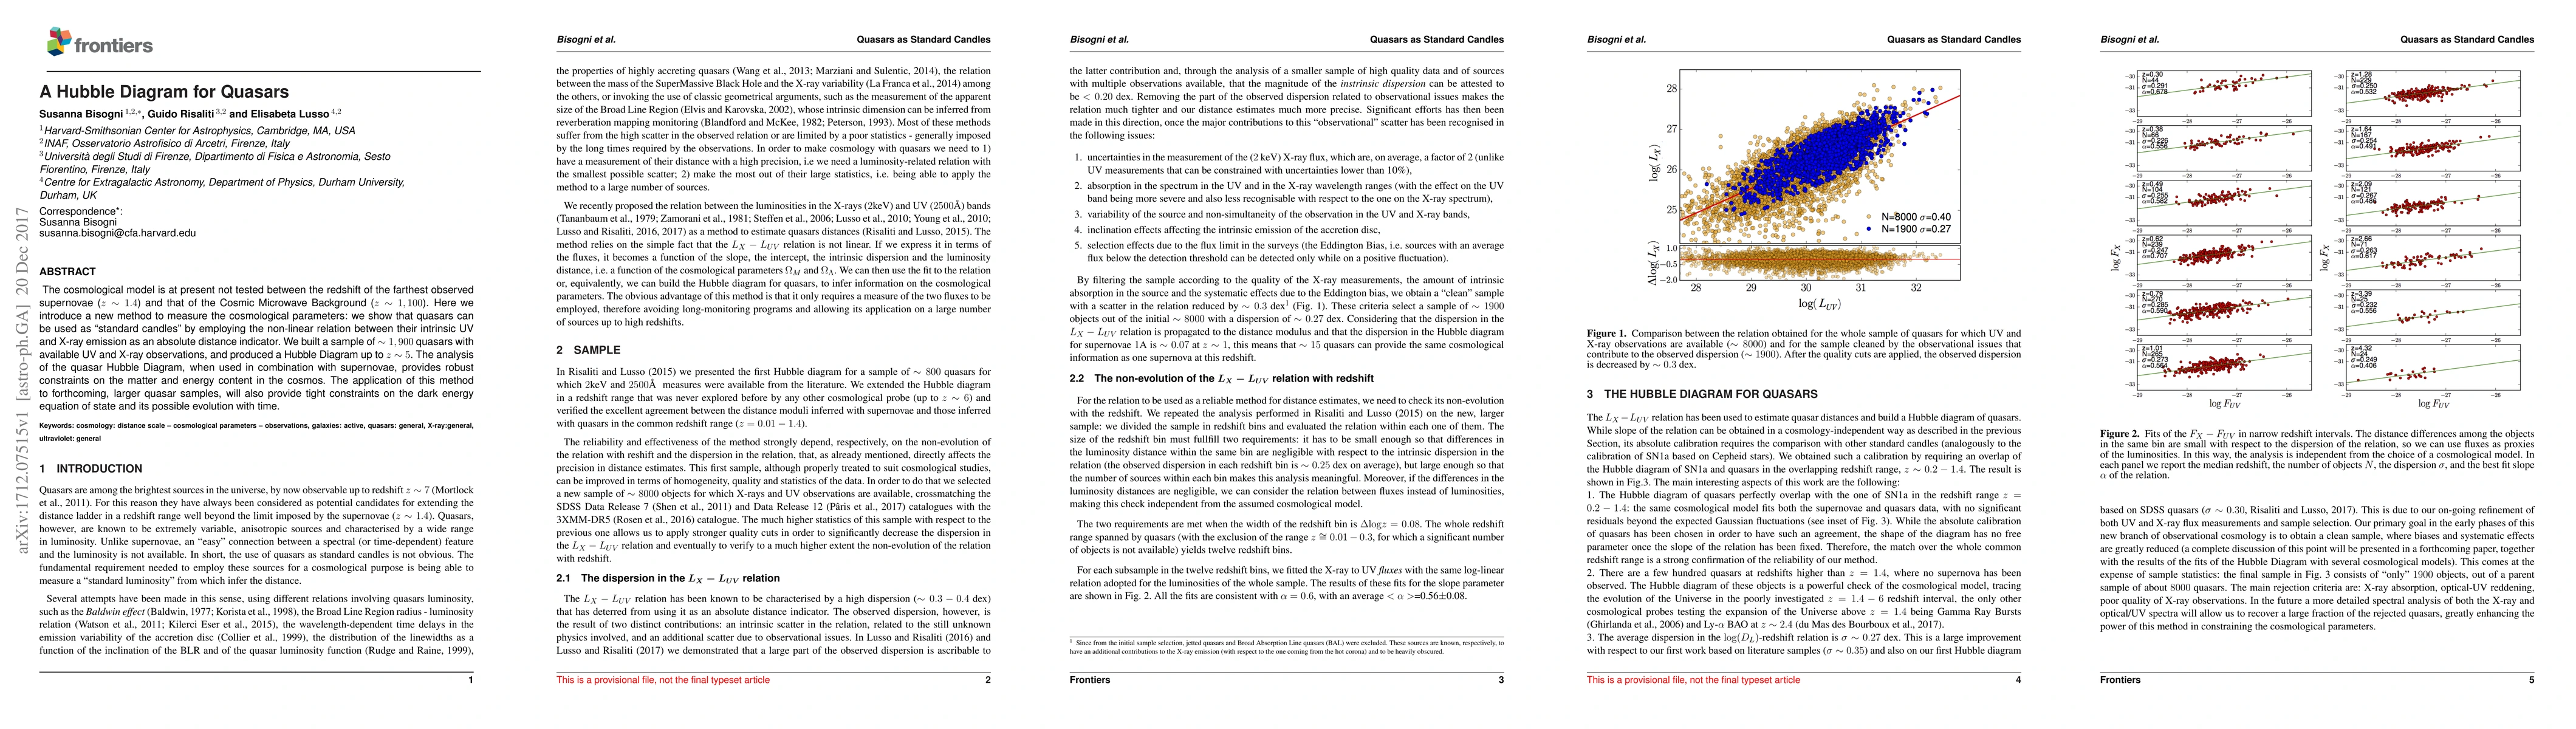
The cosmological model is at present not tested between the redshift of the farthest observed supernovae (z ~ 1.4) and that of the Cosmic Microwave Background (z ~ 1,100). Here we introduce a new method to measure the cosmological parameters: we show that quasars can be used as "standard candles" by employing the non-linear relation between their intrinsic UV and X-ray emission as an absolute distance indicator. We built a sample of ~ 1,900 quasars with available UV and X-ray observations, and produced a Hubble Diagram up to z ~ 5. The analysis of the quasar Hubble Diagram, when used in combination with supernovae, provides robust constraints on the matter and energy content in the cosmos. The application of this method to forthcoming, larger quasar samples, will also provide tight constraints on the dark energy equation of state and its possible evolution with time.
AI Key Findings
Get AI-generated insights about this paper's methodology, results, significance, and more — seven facets brought into focus.
Impact
Paper Details
PDF Preview
Key Terms
Citation Network
Current paper (gray), citations (green), references (blue)
Display is limited for performance on very large graphs.
Discussion 0