Summary
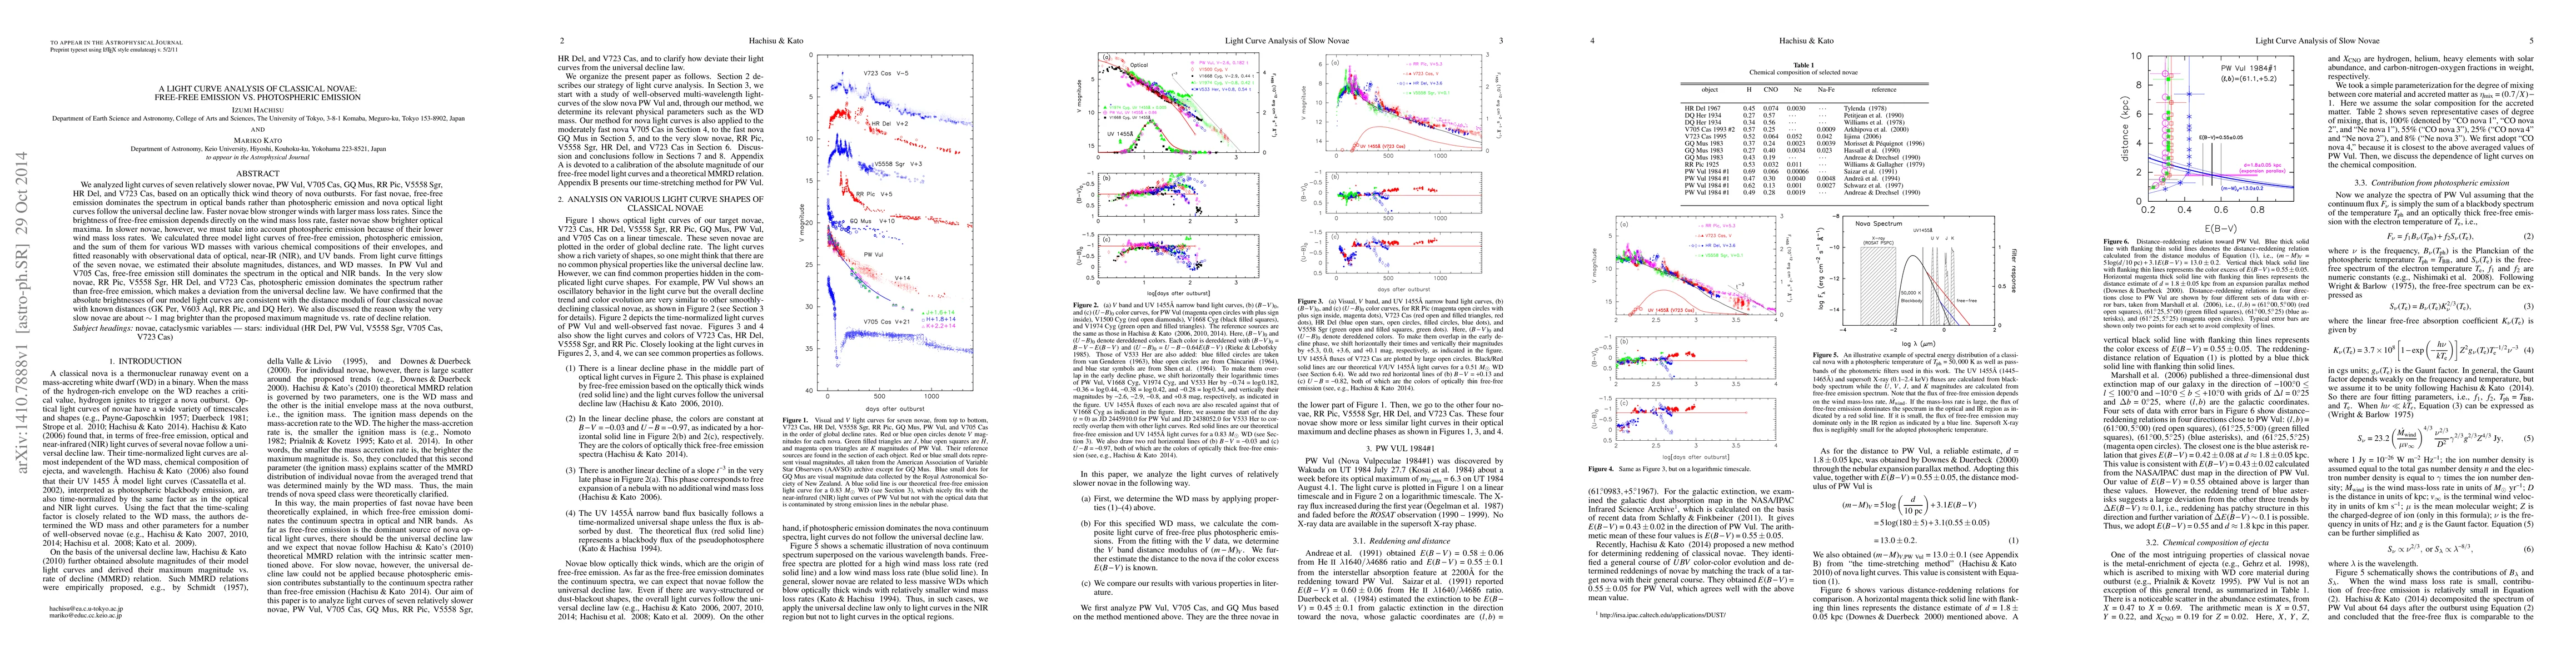
We analyzed light curves of seven relatively slower novae, PW Vul, V705 Cas, GQ Mus, RR Pic, V5558 Sgr, HR Del, and V723 Cas, based on an optically thick wind theory of nova outbursts. For fast novae, free-free emission dominates the spectrum in optical bands rather than photospheric emission and nova optical light curves follow the universal decline law. Faster novae blow stronger winds with larger mass loss rates. Since the brightness of free-free emission depends directly on the wind mass loss rate, faster novae show brighter optical maxima. In slower novae, however, we must take into account photospheric emission because of their lower wind mass loss rates. We calculated three model light curves of free-free emission, photospheric emission, and the sum of them for various WD masses with various chemical compositions of their envelopes, and fitted reasonably with observational data of optical, near-IR (NIR), and UV bands. From light curve fittings of the seven novae, we estimated their absolute magnitudes, distances, and WD masses. In PW Vul and V705 Cas, free-free emission still dominates the spectrum in the optical and NIR bands. In the very slow novae, RR Pic, V5558 Sgr, HR Del, and V723 Cas, photospheric emission dominates the spectrum rather than free-free emission, which makes a deviation from the universal decline law. We have confirmed that the absolute brightnesses of our model light curves are consistent with the distance moduli of four classical novae with known distances (GK Per, V603 Aql, RR Pic, and DQ Her). We also discussed the reason why the very slow novae are about 1 mag brighter than the proposed maximum magnitude vs. rate of decline relation.
AI Key Findings
Get AI-generated insights about this paper's methodology, results, and significance.
Paper Details
PDF Preview
Key Terms
Citation Network
Current paper (gray), citations (green), references (blue)
Display is limited for performance on very large graphs.
Similar Papers
Found 4 papers| Title | Authors | Year | Actions |
|---|
Comments (0)