A Link Mixture Model for Spatio-temporal Infection Data, with Applications to the COVID Epidemic
Publication
Metrics
AI Quick Summary
This paper proposes a mixture link model for spatio-temporal infection data to handle significant time fluctuations and spatial diffusion, particularly during epidemic phases. The model is applied to COVID-19 data in London boroughs and South East England to demonstrate its adaptability to both explosive and endemic infection patterns.
Paper Preview
Abstract
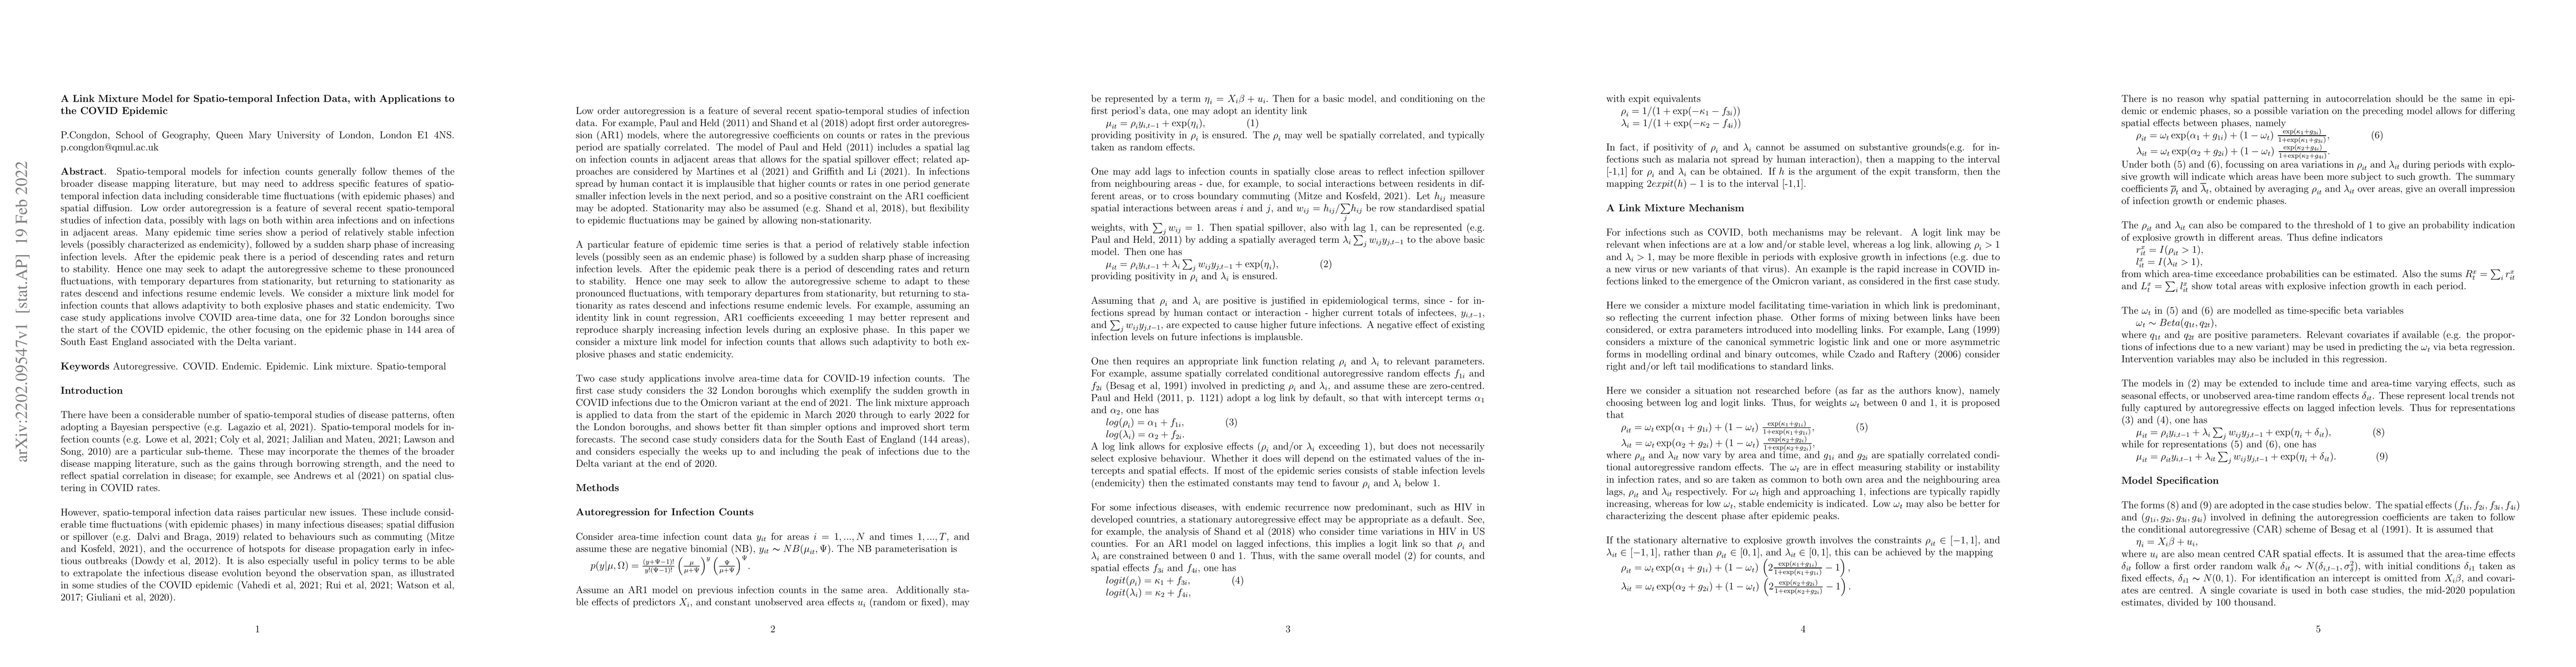
Spatio-temporal models for infection counts generally follow themes of the broader disease mapping literature, but may need to address specific features of spatio-temporal infection data including considerable time fluctuations (with epidemic phases) and spatial diffusion. Low order autoregression is a feature of several recent spatio-temporal studies of infection data, possibly with lags on both within area infections and on infections in adjacent areas. Many epidemic time series show a period of relatively stable infection levels (possibly characterized as endemicity), followed by a sudden sharp phase of increasing infection levels. After the epidemic peak there is a period of descending rates and return to stability. Hence one may seek to adapt the autoregressive scheme to these pronounced fluctuations, with temporary departures from stationarity, but returning to stationarity as rates descend and infections resume endemic levels. We consider a mixture link model for infection counts that allows adaptivity to both explosive phases and static endemicity. Two case study applications involve COVID area-time data, one for 32 London boroughs since the start of the COVID epidemic, the other focusing on the epidemic phase in 144 area of South East England associated with the Delta variant.
AI Key Findings
Get AI-generated insights about this paper's methodology, results, significance, and more — seven facets brought into focus.
Impact
Paper Details
Authors
PDF Preview
Key Terms
Citation Network
Current paper (gray), citations (green), references (blue)
Display is limited for performance on very large graphs.
Discussion 0