Summary
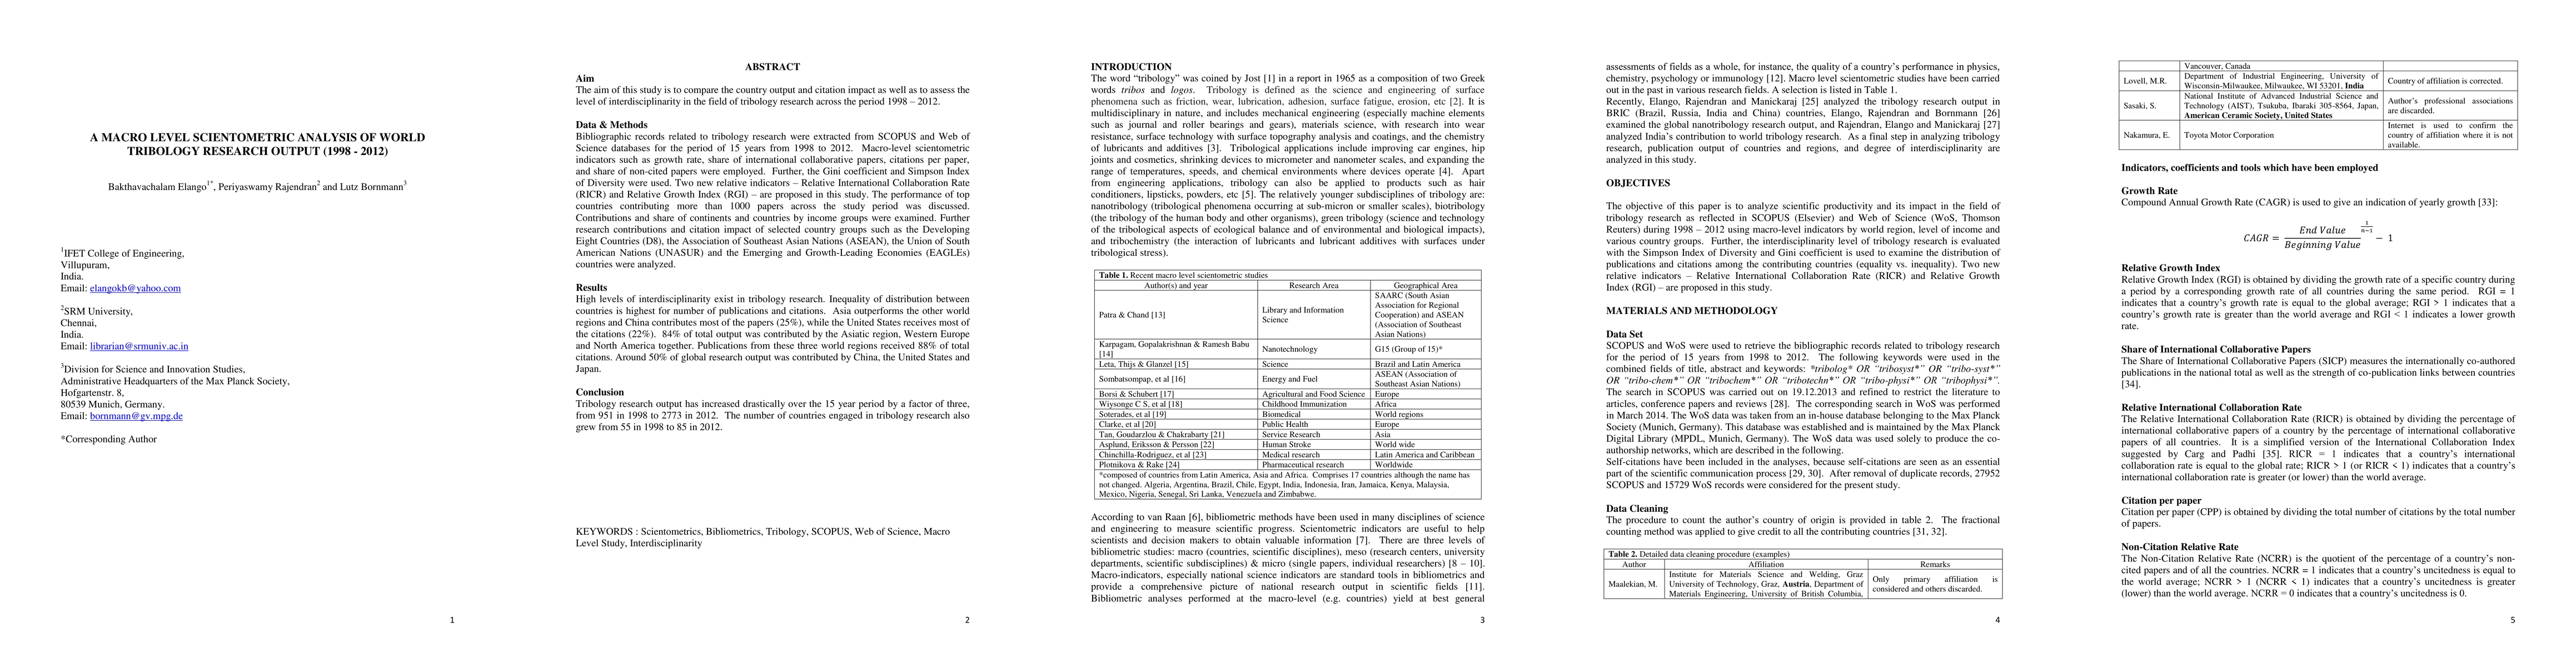
Bibliographic records related to tribology research were extracted from SCOPUS and Web of Science databases for the period of 15 years from 1998 to 2012. Macro-level scientometric indicators such as growth rate, share of international collaborative papers, citations per paper, and share of non-cited papers were employed. Further, the Gini coefficient and Simpson Index of Diversity were used. Two new relative indicators : Relative International Collaboration Rate (RICR) and Relative Growth Index (RGI) are proposed in this study. The performance of top countries contributing more than 1000 papers across the study period was discussed. Contributions and share of continents and countries by income groups were examined. Further research contributions and citation impact of selected country groups such as the Developing Eight Countries (D8), the Association of Southeast Asian Nations (ASEAN), the Union of South American Nations (UNASUR) and the Emerging and Growth-Leading Economies (EAGLEs) countries were analyzed. High levels of interdisciplinarity exist in tribology research. Inequality of distribution between countries is highest for number of publications and citations. Asia outperforms the other world regions and China contributes most of the papers (25%), while the United States receives most of the citations (22%). 84% of total output was contributed by the Asiatic region, Western Europe and North America together. Publications from these three world regions received 88% of total citations. Around 50% of global research output was contributed by China, the United States and Japan.
AI Key Findings
Get AI-generated insights about this paper's methodology, results, and significance.
Paper Details
PDF Preview
Key Terms
Citation Network
Current paper (gray), citations (green), references (blue)
Display is limited for performance on very large graphs.
Similar Papers
Found 4 papers| Title | Authors | Year | Actions |
|---|
Comments (0)