A method to benchmark high-dimensional process drift detection
Publication
Metrics
AI Quick Summary
This paper introduces a synthetic framework for generating process curves to benchmark machine learning algorithms for detecting drifts in high-dimensional data. It proposes a new evaluation metric, the temporal area under the curve, and conducts a comparative study of various machine learning methods using this synthetic data.
Paper Preview
Abstract
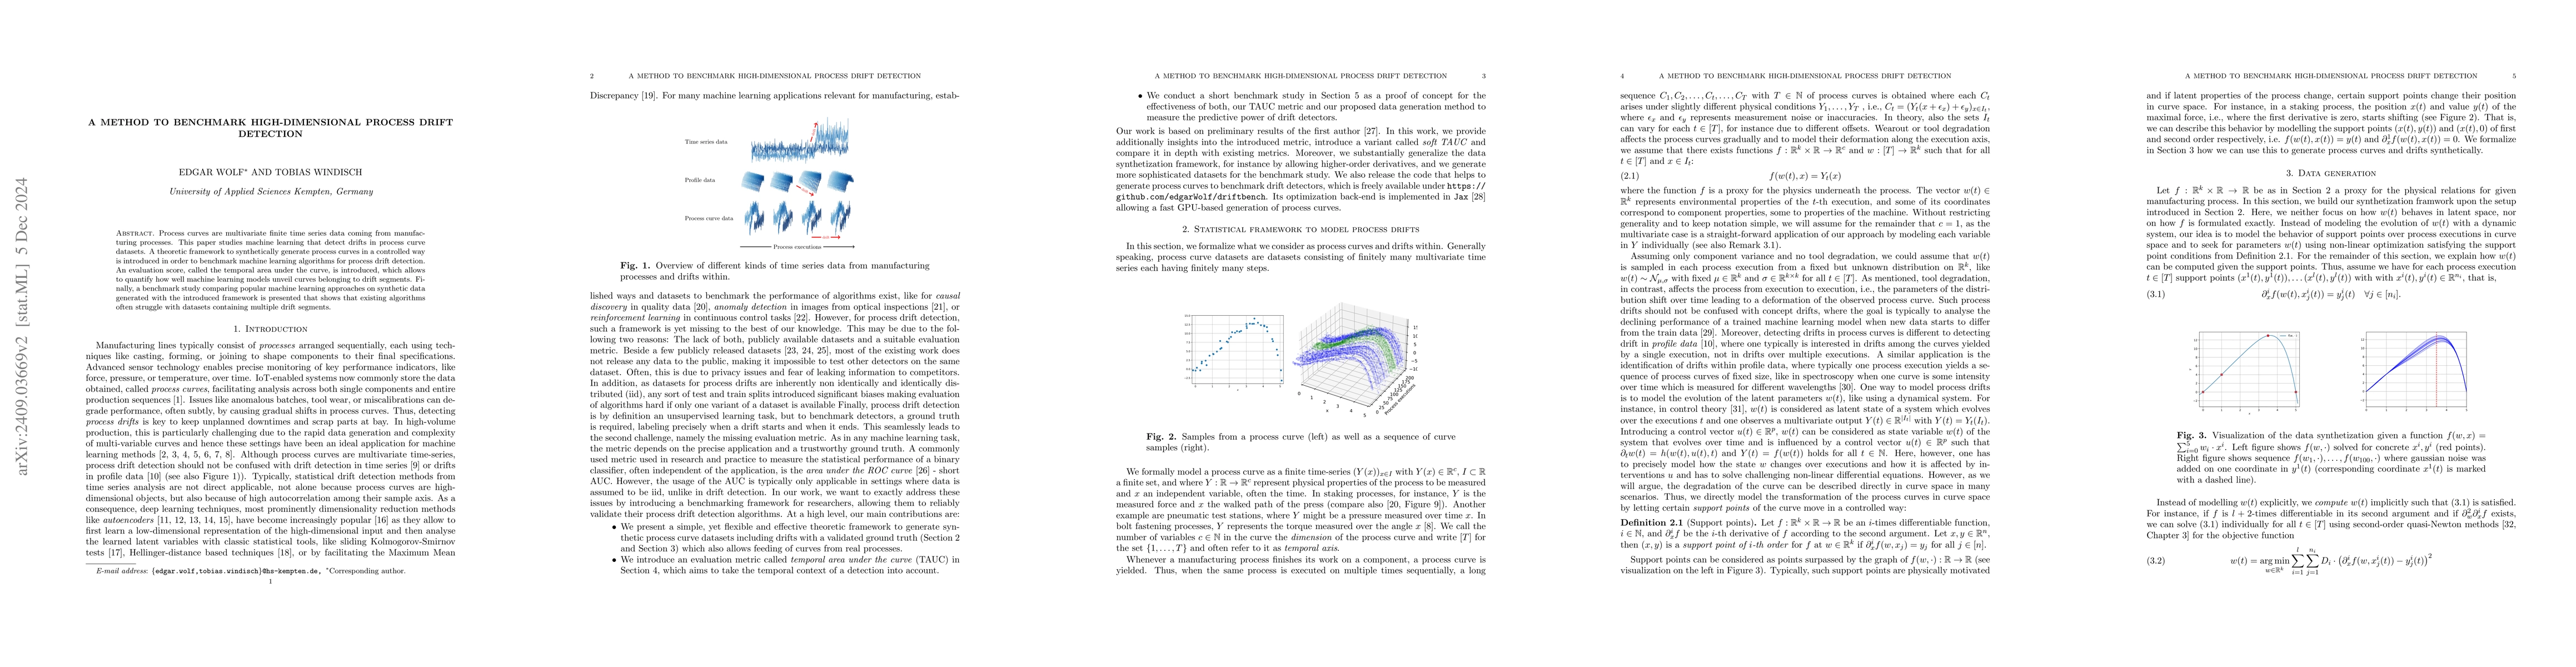
Process curves are multi-variate finite time series data coming from manufacturing processes. This paper studies machine learning methods for drifts of process curves. A theoretic framework to synthetically generate process curves in a controlled way is introduced in order to benchmark machine learning algorithms for process drift detection. A evaluation score, called the temporal area under the curve, is introduced, which allows to quantify how well machine learning models unveil curves belonging to drift segments. Finally, a benchmark study comparing popular machine learning approaches on synthetic data generated with the introduced framework shown.
AI Key Findings
Get AI-generated insights about this paper's methodology, results, significance, and more — seven facets brought into focus.
Impact
Authors
PDF Preview
Citation Network
Current paper (gray), citations (green), references (blue)
Display is limited for performance on very large graphs.
Discussion 0