Summary
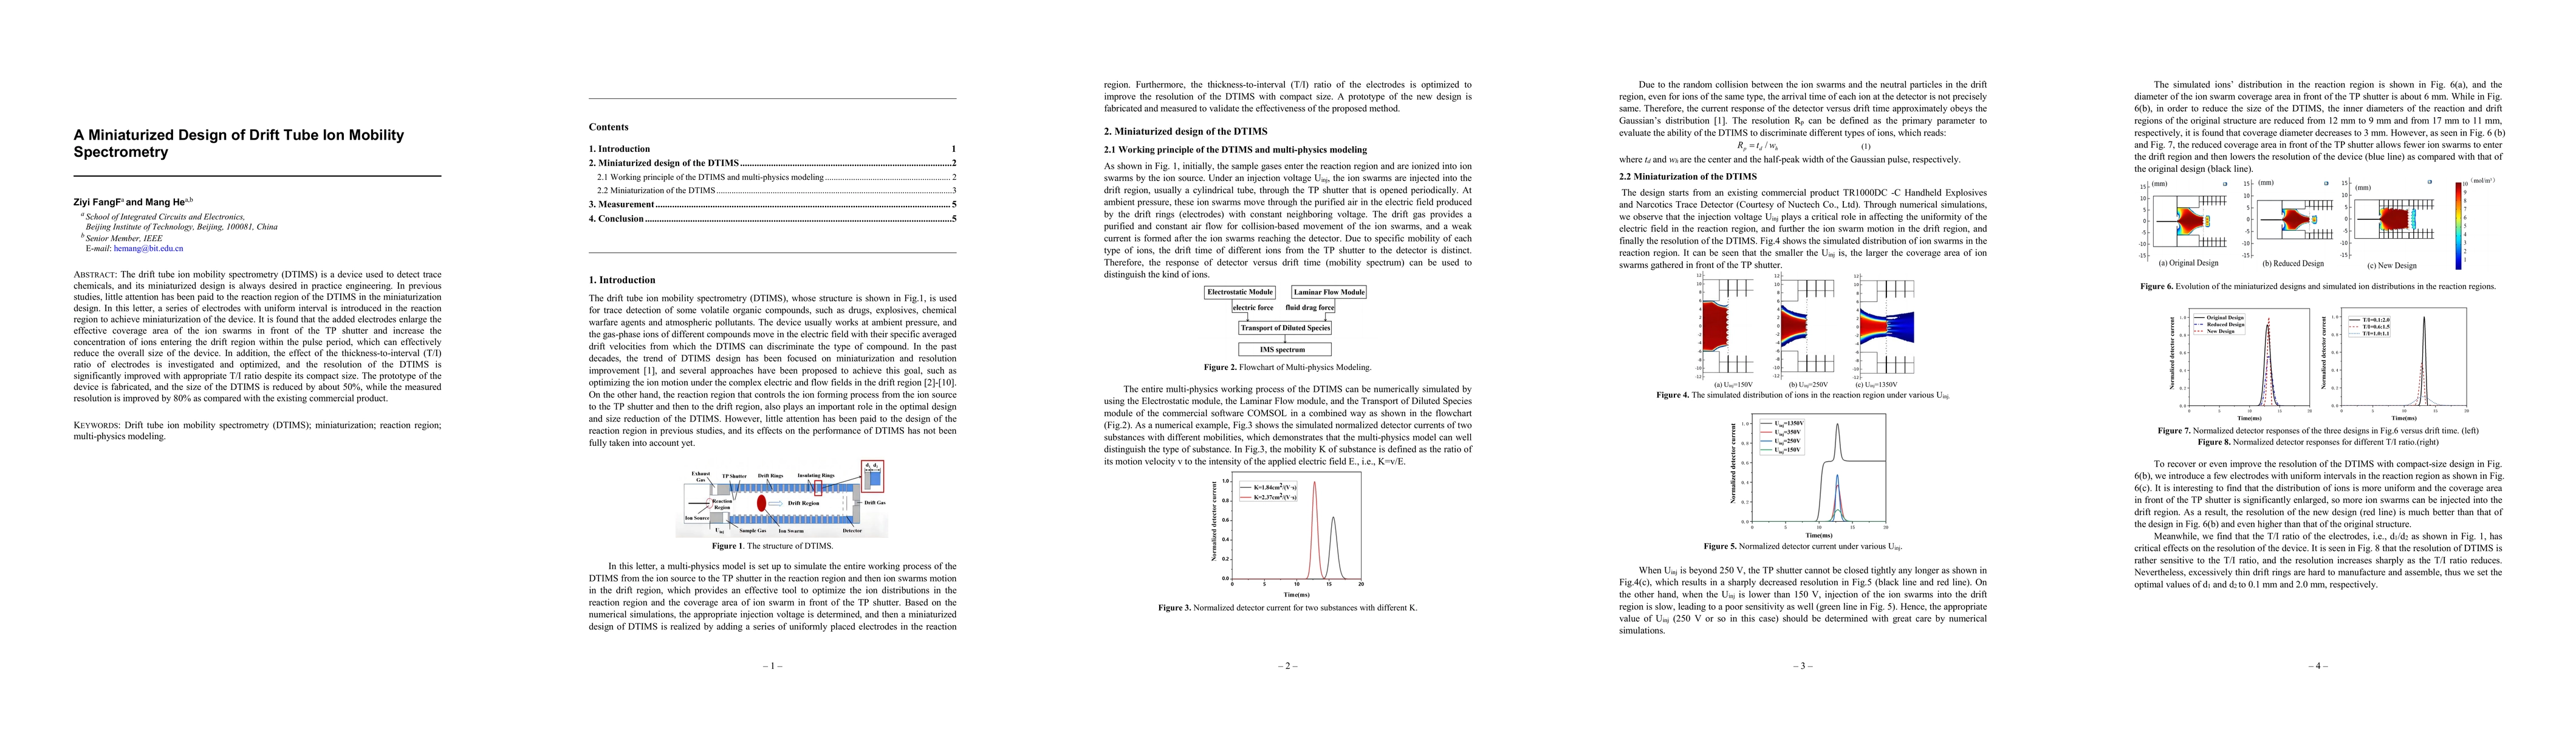
The drift tube ion mobility spectrometry (DTIMS) is a device used to detect trace chemicals, and its miniaturized design is always desired in practice engineering. In previous studies, little attention has been paid to the reaction region of the DTIMS in the miniaturization design. In this letter, a series of electrodes with uniform interval is introduced in the reaction region to achieve miniaturization of the device. It is found that the added electrodes enlarge the effective coverage area of the ion swarms in front of the TP shutter and increase the concentration of ions entering the drift region within the pulse period, which can effectively reduce the overall size of the device. In addition, the effect of the thickness-to-interval (T/I) ratio of electrodes is investigated and optimized, and the resolution of the DTIMS is significantly improved with appropriate T/I ratio despite its compact size. The prototype of the device is fabricated, and the size of the DTIMS is reduced by about 50%, while the measured resolution is improved by 80% as compared with the existing commercial product.
AI Key Findings
Get AI-generated insights about this paper's methodology, results, and significance.
Paper Details
PDF Preview
Key Terms
Citation Network
Current paper (gray), citations (green), references (blue)
Display is limited for performance on very large graphs.
Similar Papers
Found 4 papersProposal and design of 81.25 MHz heavy ion drift tube linacs for BISOL
Zhi Wang, Tianhao Wei, Ying Xia et al.
No citations found for this paper.
Comments (0)