A Model-Based Approach to Shot Charts Estimation in Basketball
Publication
Metrics
AI Quick Summary
This paper introduces a model-based approach for estimating and visualizing shot charts in basketball that accounts for the court's boundaries, using Gaussian mixtures to achieve more accurate shot density distributions. The method also leverages Bayes' rule to estimate shooting success probabilities and identify high-scoring regions, demonstrated through NBA data analysis.
Paper Preview
Abstract
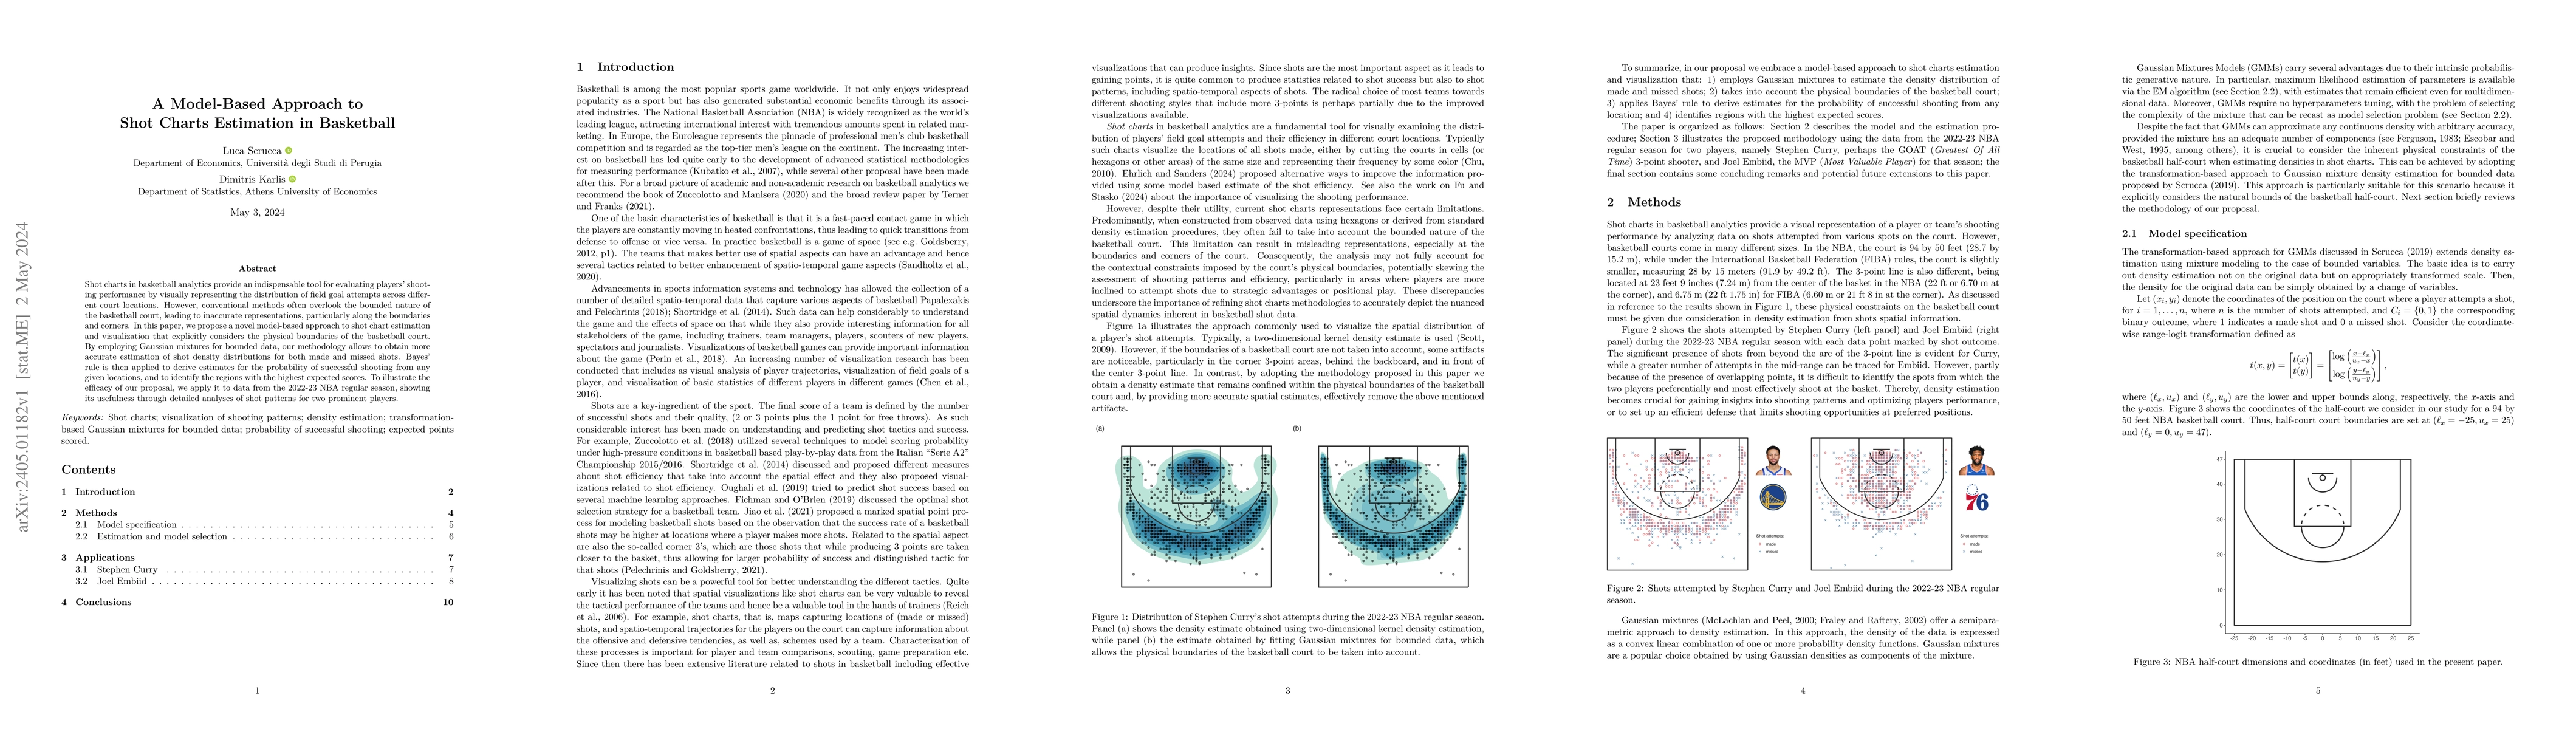
Shot charts in basketball analytics provide an indispensable tool for evaluating players' shooting performance by visually representing the distribution of field goal attempts across different court locations. However, conventional methods often overlook the bounded nature of the basketball court, leading to inaccurate representations, particularly along the boundaries and corners. In this paper, we propose a novel model-based approach to shot chart estimation and visualization that explicitly considers the physical boundaries of the basketball court. By employing Gaussian mixtures for bounded data, our methodology allows to obtain more accurate estimation of shot density distributions for both made and missed shots. Bayes' rule is then applied to derive estimates for the probability of successful shooting from any given locations, and to identify the regions with the highest expected scores. To illustrate the efficacy of our proposal, we apply it to data from the 2022-23 NBA regular season, showing its usefulness through detailed analyses of shot patterns for two prominent players.
AI Key Findings
Get AI-generated insights about this paper's methodology, results, significance, and more — seven facets brought into focus.
Impact
Paper Details
Authors
PDF Preview
Key Terms
Citation Network
Current paper (gray), citations (green), references (blue)
Display is limited for performance on very large graphs.
Discussion 0