A multi-objective time series analysis of community mobility reduction comparing first and second COVID-19 waves
Publication
Metrics
AI Quick Summary
This paper compares community mobility reduction rates between the first and second COVID-19 waves in various American and European localities using Google Community Mobility Reports. The study employs multi-objective analysis and visualization to assess the effectiveness of social distancing measures during lockdowns, revealing significant locality-specific variations in mobility reduction.
Paper Preview
Abstract
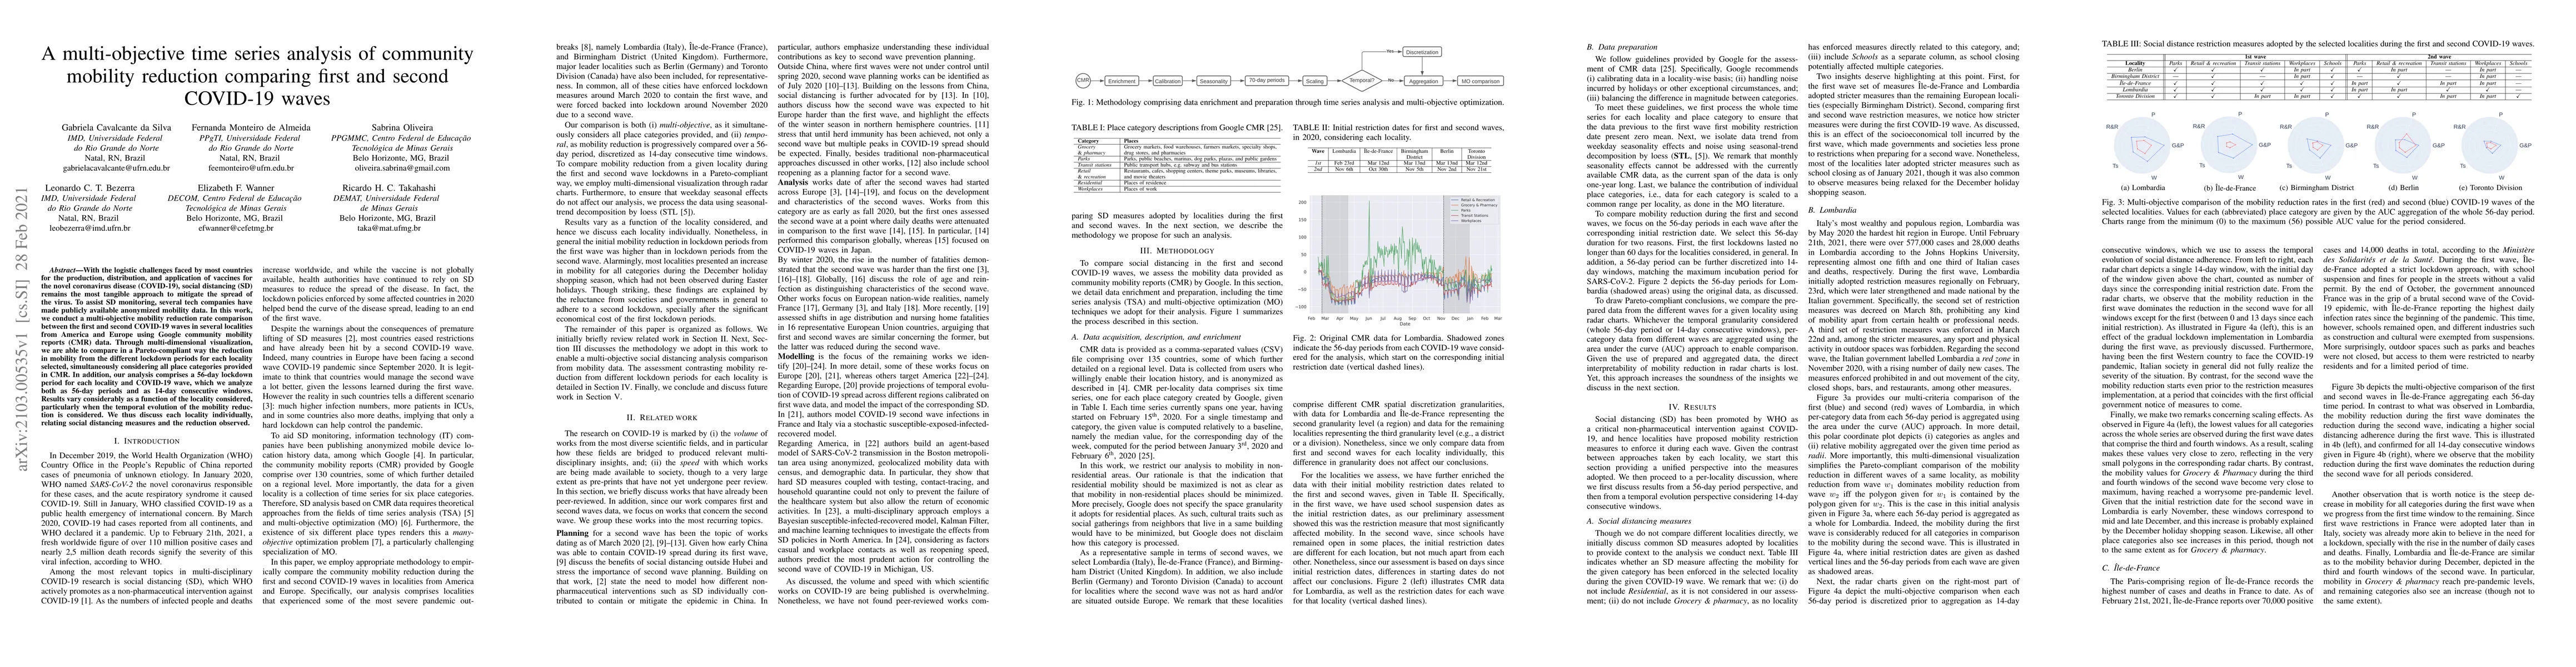
With the logistic challenges faced by most countries for the production, distribution, and application of vaccines for the novel coronavirus disease~(COVID-19), social distancing~(SD) remains the most tangible approach to mitigate the spread of the virus. To assist SD monitoring, several tech companies have made publicly available anonymized mobility data. In this work, we conduct a multi-objective mobility reduction rate comparison between the first and second COVID-19 waves in several localities from America and Europe using Google community mobility reports~(CMR) data. Through multi-dimensional visualization, we are able to compare in a Pareto-compliant way the reduction in mobility from the different lockdown periods for each locality selected, simultaneously considering all place categories provided in CMR. In addition, our analysis comprises a 56-day lockdown period for each locality and COVID-19 wave, which we analyze both as 56-day periods and as 14-day consecutive windows. Results vary considerably as a function of the locality considered, particularly when the temporal evolution of the mobility reduction is considered. We thus discuss each locality individually, relating social distancing measures and the reduction observed.
AI Key Findings
Get AI-generated insights about this paper's methodology, results, significance, and more — seven facets brought into focus.
Impact
Paper Details
Authors
PDF Preview
Key Terms
Citation Network
Current paper (gray), citations (green), references (blue)
Display is limited for performance on very large graphs.
Discussion 0