A Multi-scale Visual Analytics Approach for Exploring Biomedical Knowledge
Publication
Metrics
AI Quick Summary
This paper presents a multi-scale visual analytics framework for exploring large-scale biomedical knowledge, utilizing global and local views, and various graph layouts to facilitate interactive analysis. The approach supports diverse therapeutic use cases and has shown effectiveness in early expert interactions with large biological graphs.
Paper Preview
Abstract
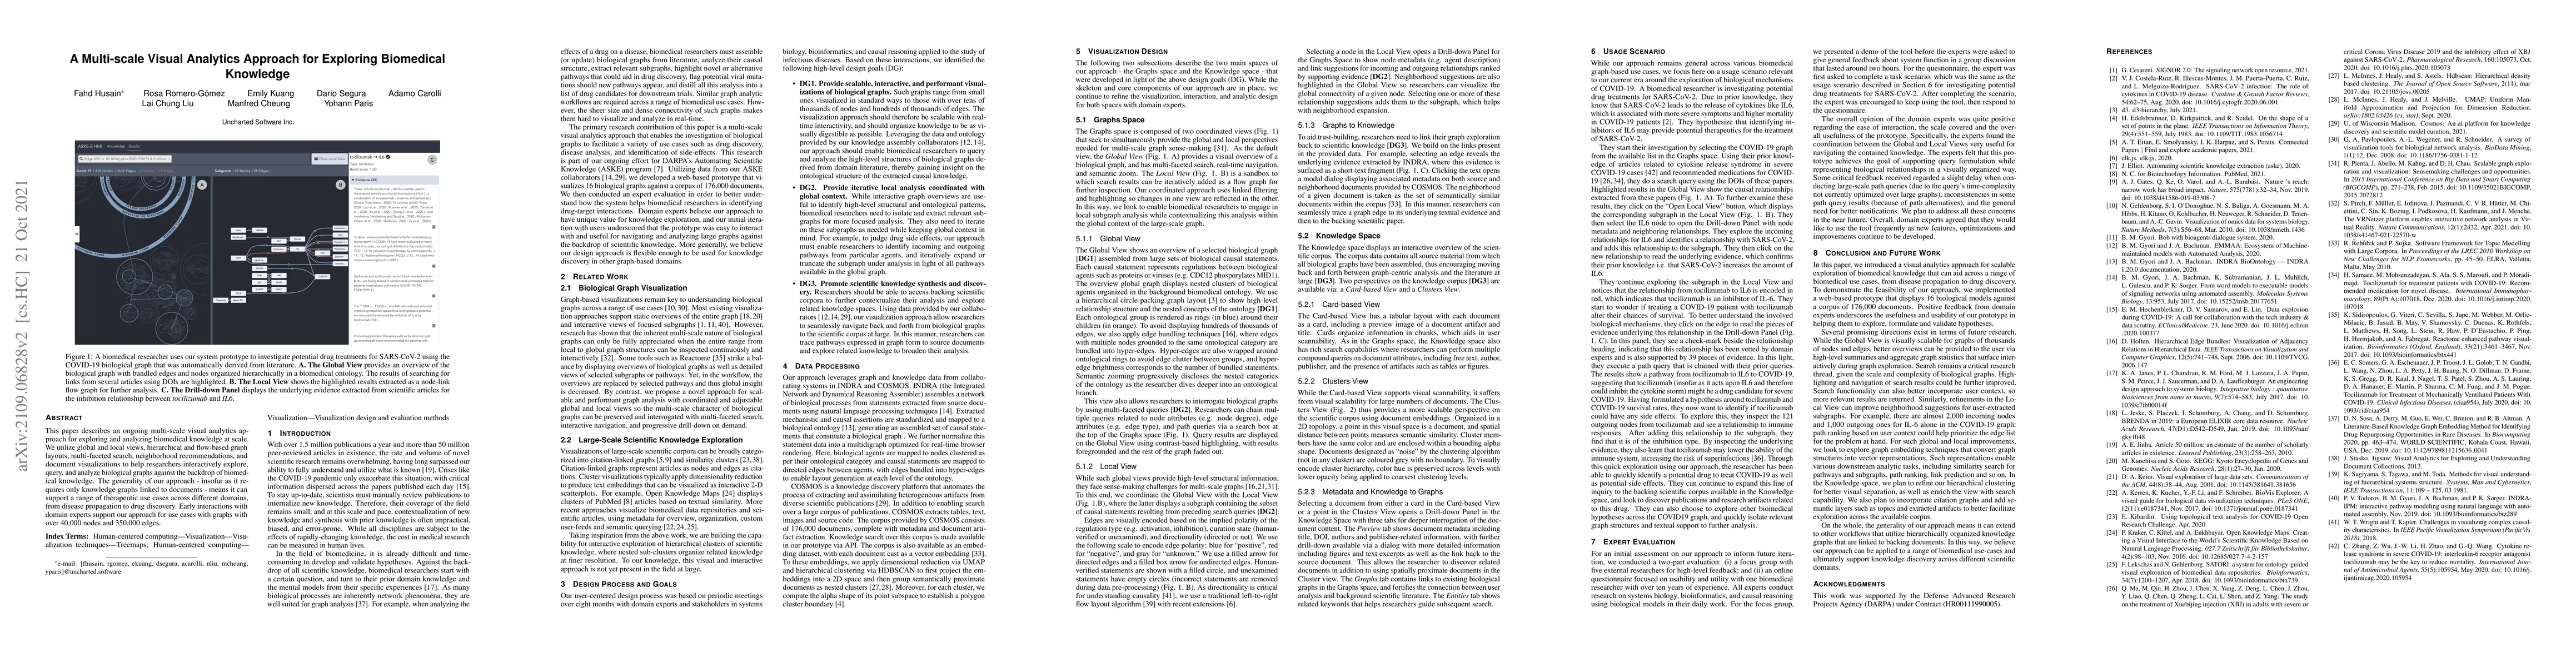
This paper describes an ongoing multi-scale visual analytics approach for exploring and analyzing biomedical knowledge at scale.We utilize global and local views, hierarchical and flow-based graph layouts, multi-faceted search, neighborhood recommendations, and document visualizations to help researchers interactively explore, query, and analyze biological graphs against the backdrop of biomedical knowledge. The generality of our approach - insofar as it re-quires only knowledge graphs linked to documents - means it can support a range of therapeutic use cases across different domains, from disease propagation to drug discovery. Early interactions with domain experts support our approach for use cases with graphs with over 40,000 nodes and 350,000 edges.
AI Key Findings
Get AI-generated insights about this paper's methodology, results, significance, and more — seven facets brought into focus.
Impact
Paper Details
PDF Preview
Key Terms
Citation Network
Current paper (gray), citations (green), references (blue)
Display is limited for performance on very large graphs.
Discussion 0