Summary
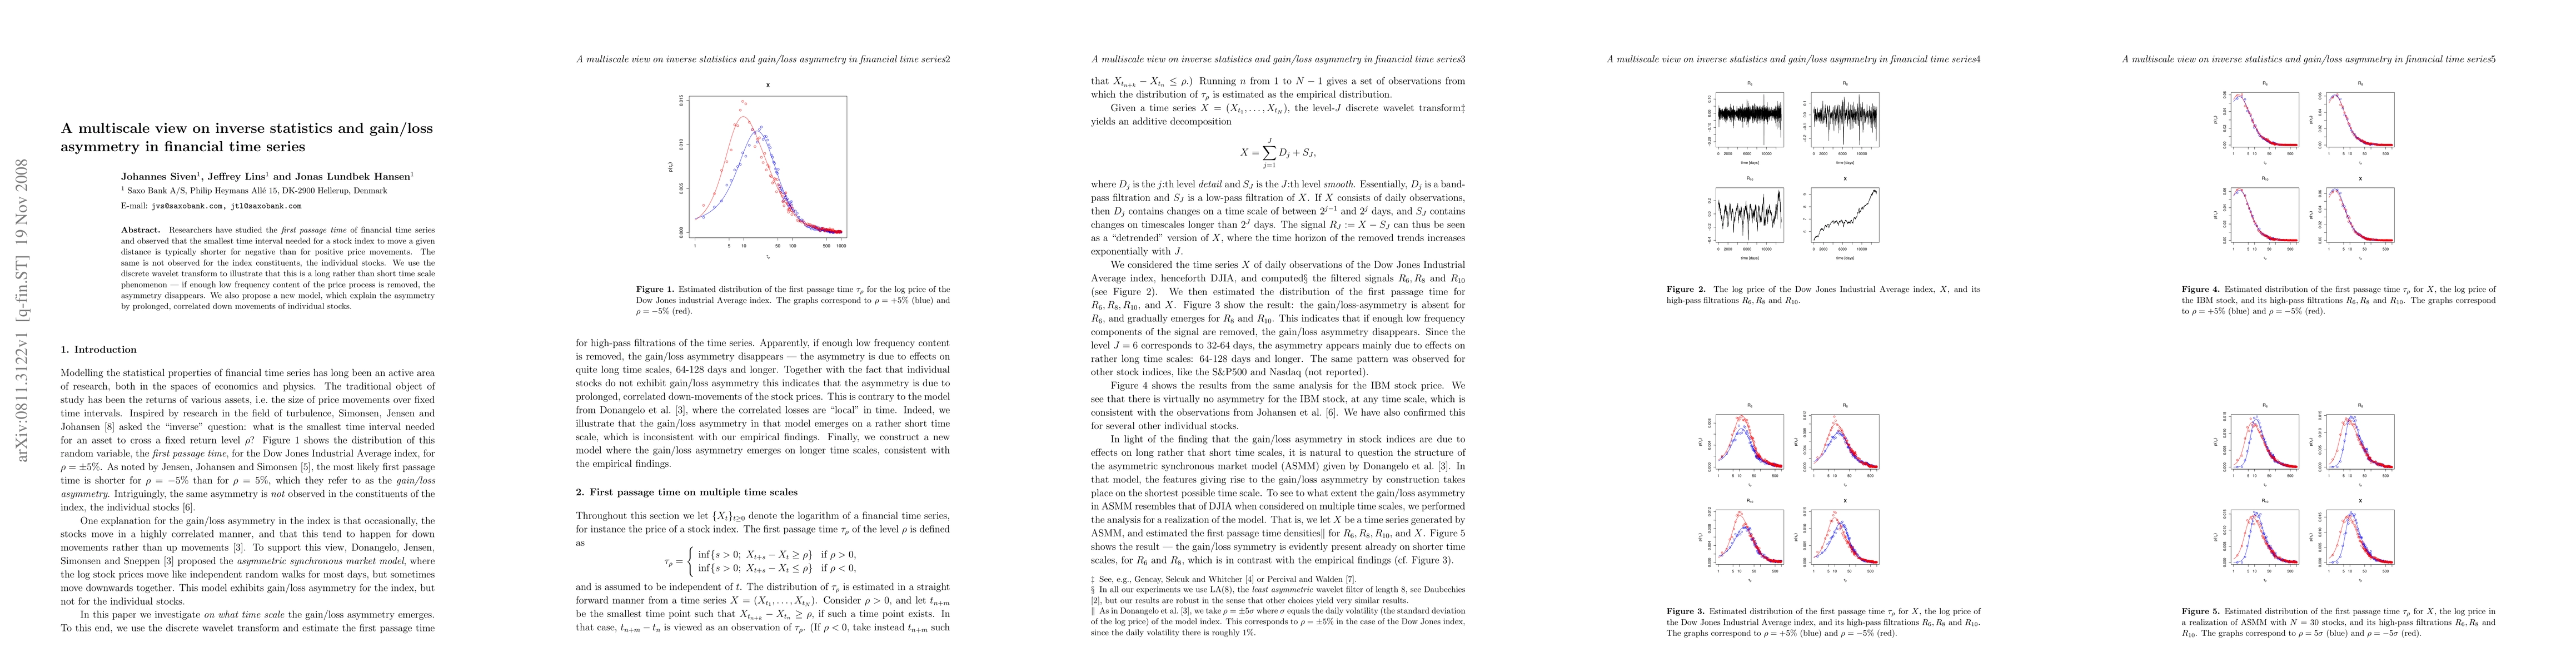
Researchers have studied the first passage time of financial time series and observed that the smallest time interval needed for a stock index to move a given distance is typically shorter for negative than for positive price movements. The same is not observed for the index constituents, the individual stocks. We use the discrete wavelet transform to illustrate that this is a long rather than short time scale phenomenon -- if enough low frequency content of the price process is removed, the asymmetry disappears. We also propose a new model, which explain the asymmetry by prolonged, correlated down movements of individual stocks.
AI Key Findings
Get AI-generated insights about this paper's methodology, results, and significance.
Paper Details
PDF Preview
Key Terms
Citation Network
Current paper (gray), citations (green), references (blue)
Display is limited for performance on very large graphs.
Similar Papers
Found 4 papers| Title | Authors | Year | Actions |
|---|
Comments (0)