A Multivariate Extreme Value Theory Approach to Anomaly Clustering and Visualization
Publication
Metrics
AI Quick Summary
This paper develops a novel approach to anomaly clustering using multivariate extreme value theory, enabling the identification of similar anomalies and providing an informative 2D visual display.
Paper Preview
Abstract
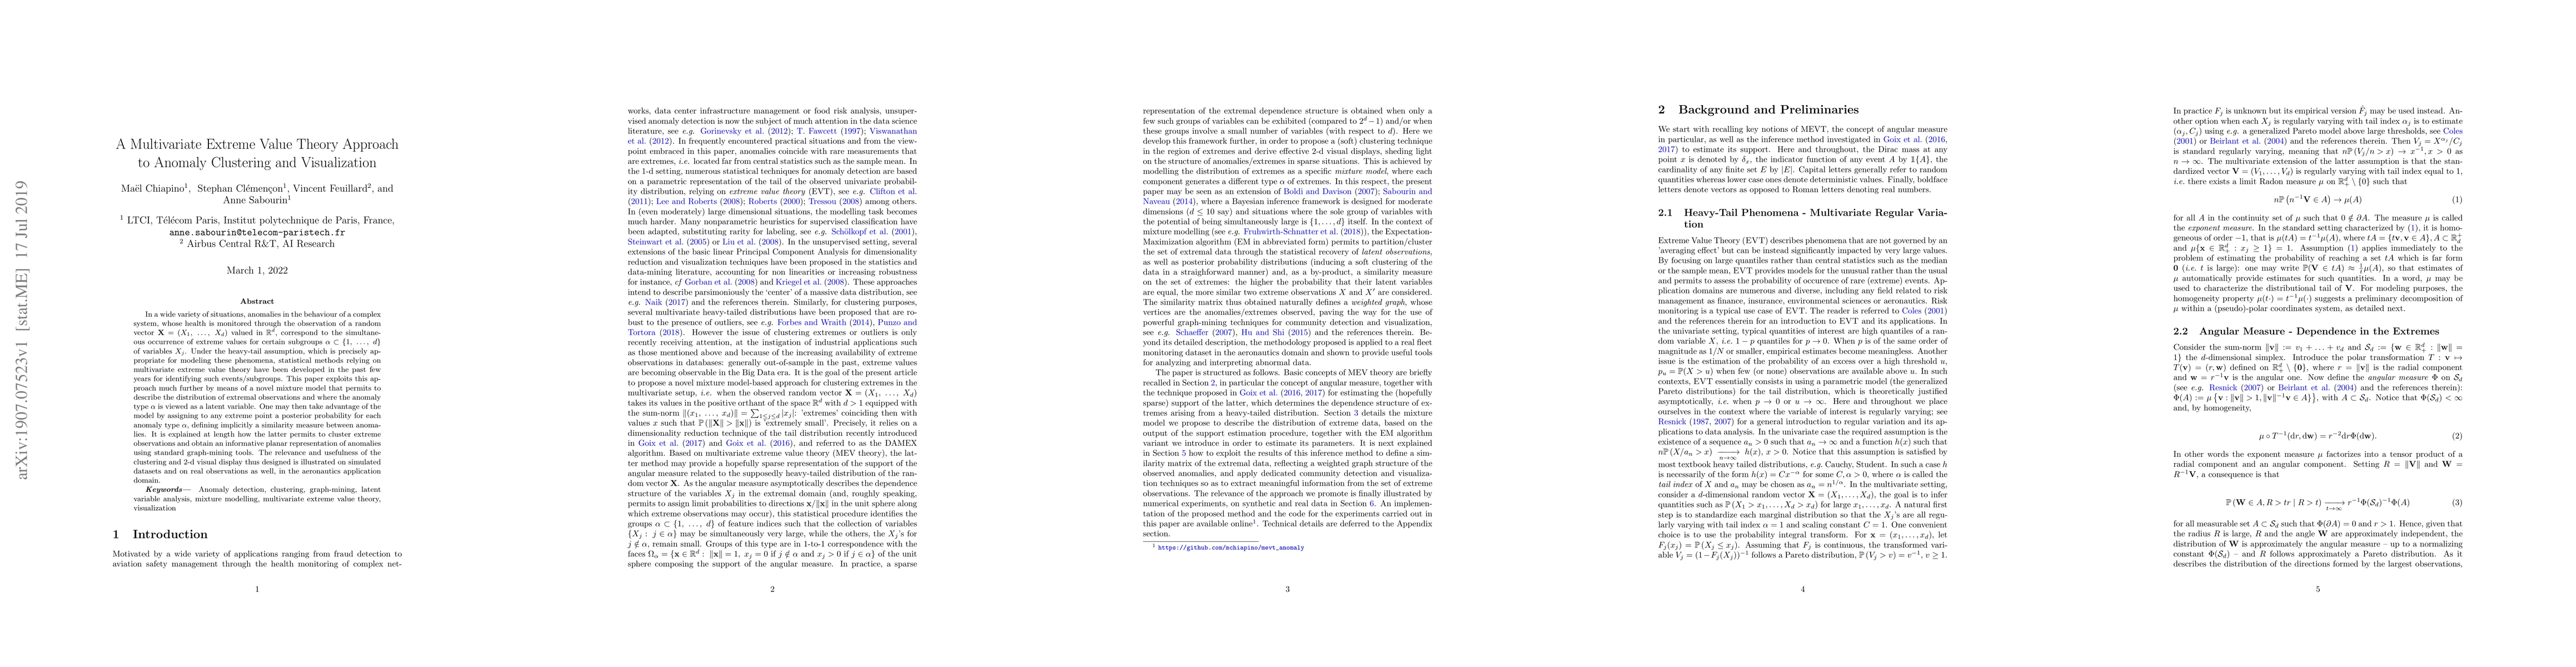
In a wide variety of situations, anomalies in the behaviour of a complex system, whose health is monitored through the observation of a random vector X = (X1,. .. , X d) valued in R d , correspond to the simultaneous occurrence of extreme values for certain subgroups $\alpha$ $\subset$ {1,. .. , d} of variables Xj. Under the heavy-tail assumption, which is precisely appropriate for modeling these phenomena, statistical methods relying on multivariate extreme value theory have been developed in the past few years for identifying such events/subgroups. This paper exploits this approach much further by means of a novel mixture model that permits to describe the distribution of extremal observations and where the anomaly type $\alpha$ is viewed as a latent variable. One may then take advantage of the model by assigning to any extreme point a posterior probability for each anomaly type $\alpha$, defining implicitly a similarity measure between anomalies. It is explained at length how the latter permits to cluster extreme observations and obtain an informative planar representation of anomalies using standard graph-mining tools. The relevance and usefulness of the clustering and 2-d visual display thus designed is illustrated on simulated datasets and on real observations as well, in the aeronautics application domain.
AI Key Findings
Get AI-generated insights about this paper's methodology, results, significance, and more — seven facets brought into focus.
Impact
Paper Details
PDF Preview
Key Terms
Citation Network
Current paper (gray), citations (green), references (blue)
Display is limited for performance on very large graphs.
Discussion 0