Authors
Summary
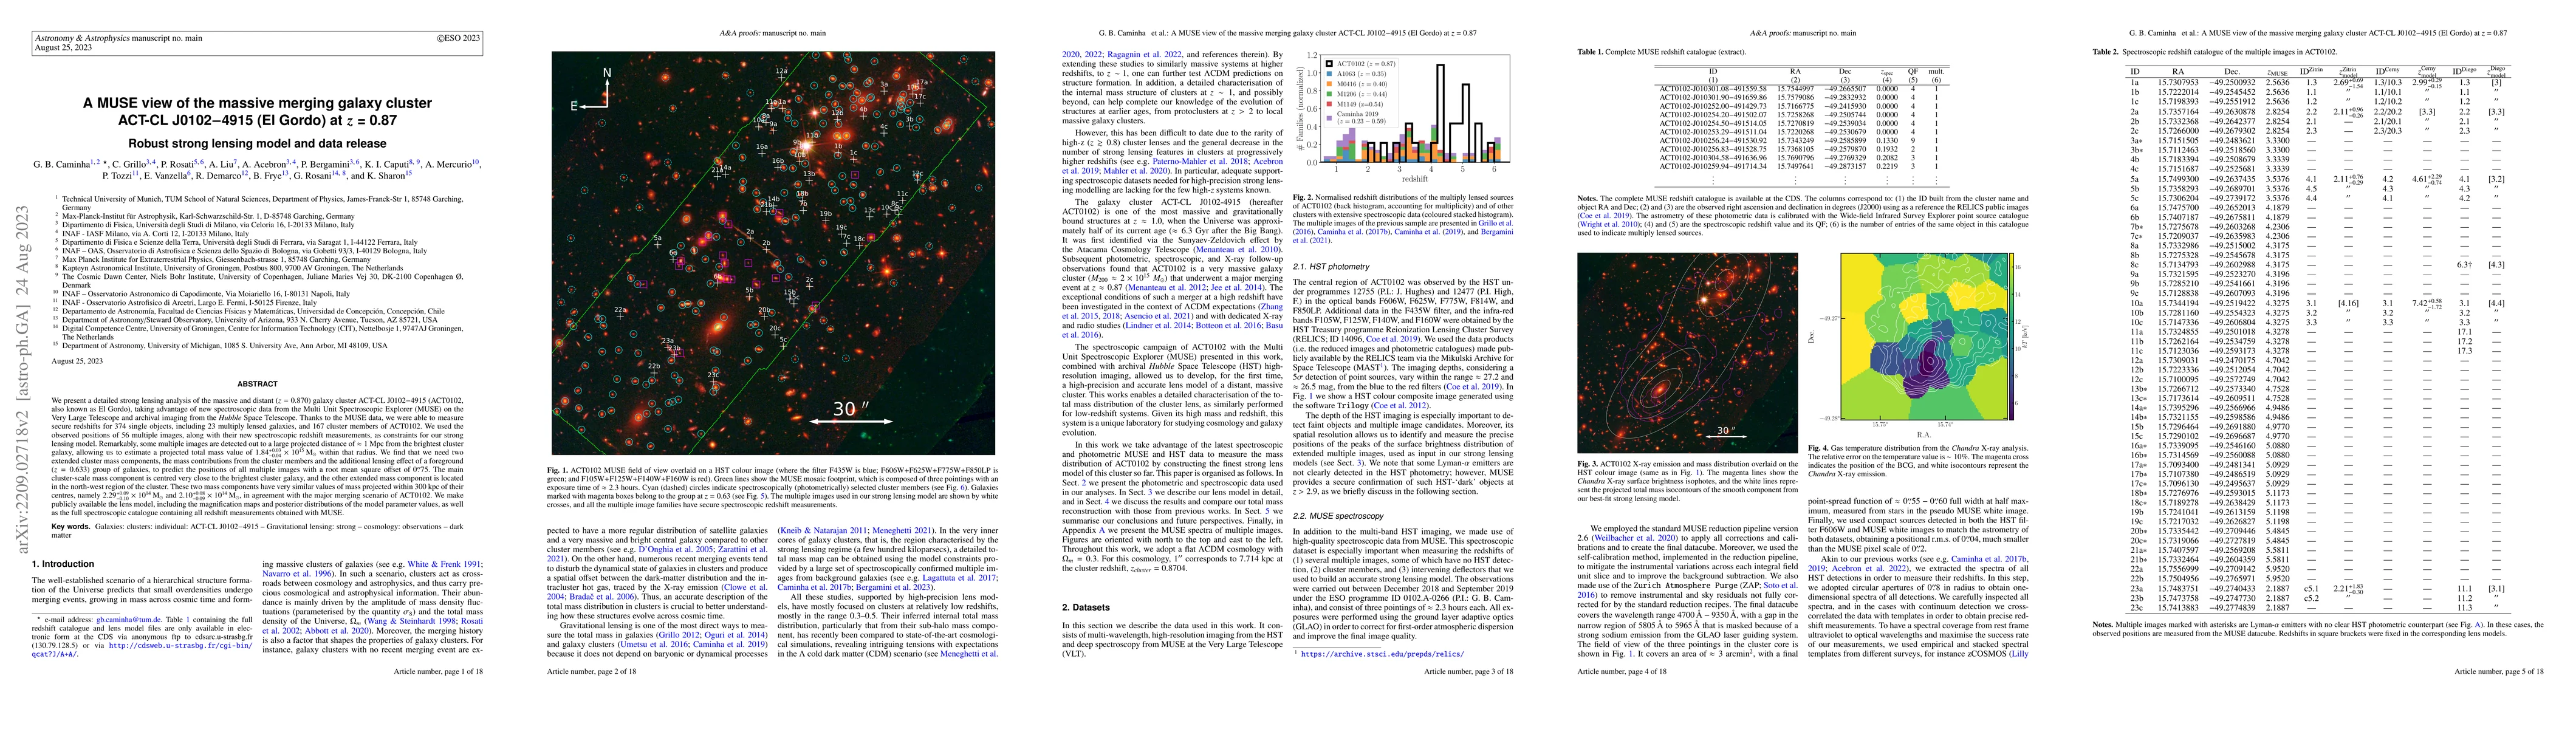
We present a detailed strong lensing analysis of the massive and distant ($z=0.870$) galaxy cluster ACT-CL J0102$-$4915 (ACT0102, also known as El Gordo), taking advantage of new spectroscopic data from the Multi Unit Spectroscopic Explorer (MUSE) on the Very Large Telescope, and archival imaging from the Hubble Space Telescope. Thanks to the MUSE data, we measure secure redshifts for 374 single objects, including 23 multiply lensed galaxies, and 167 cluster members of ACT0102. The observed positions of 56 multiple images, along with their new spectroscopic redshift measurements, are used as constraints for our strong lensing model. Remarkably, some multiple images are detected out to a large projected distance of $\approx 1$ Mpc from the brightest cluster galaxy, allowing us to estimate a projected total mass value of $1.84_{-0.04}^{+0.03} \times 10^{15}\, \rm M_{\odot}$ within that radius. We find that we need two extended cluster mass components, the mass contributions from the cluster members and the additional lensing effect of a foreground ($z=0.633$) group of galaxies, to predict the positions of all multiple images with a root mean square offset of $0.75"$. The main cluster-scale mass component is centered very closely to the brightest cluster galaxy and the other extended mass component is located in the north-west region of the cluster. These two mass components have very similar values of mass projected within 300 kpc from their centers, namely $2.29_{-0.10}^{+0.09}\times10^{14}\,\rm M_{\odot}$ and $2.10_{-0.09}^{+0.08}\times10^{14}\,\rm M_{\odot}$, in agreement with the major merging scenario of ACT0102. We make publicly available the lens model, including the magnification maps and posterior distributions of the model parameter values, as well as the full spectroscopic catalogue containing all redshift measurements obtained with MUSE.
AI Key Findings
Get AI-generated insights about this paper's methodology, results, and significance.
Paper Details
PDF Preview
Key Terms
Citation Network
Current paper (gray), citations (green), references (blue)
Display is limited for performance on very large graphs.
Similar Papers
Found 4 papersHead-to-Toe Measurement of El Gordo: Improved Analysis of the Galaxy Cluster ACT-CL J0102-4915 with New Wide-field Hubble Space Telescope Imaging Data
M. James Jee, Mijin Yoon, John P. Hughes et al.
| Title | Authors | Year | Actions |
|---|
Comments (0)