A new class of composite indicators: the penalized power means
Publication
Metrics
AI Quick Summary
This paper introduces a new method for constructing composite indicators based on penalized power means, which penalizes units with larger heterogeneity by scaling normalized indicators and measuring heterogeneity via a Box-Cox transformation. This approach ensures data-driven, minimum information loss, and refined rankings.
Paper Preview
Abstract
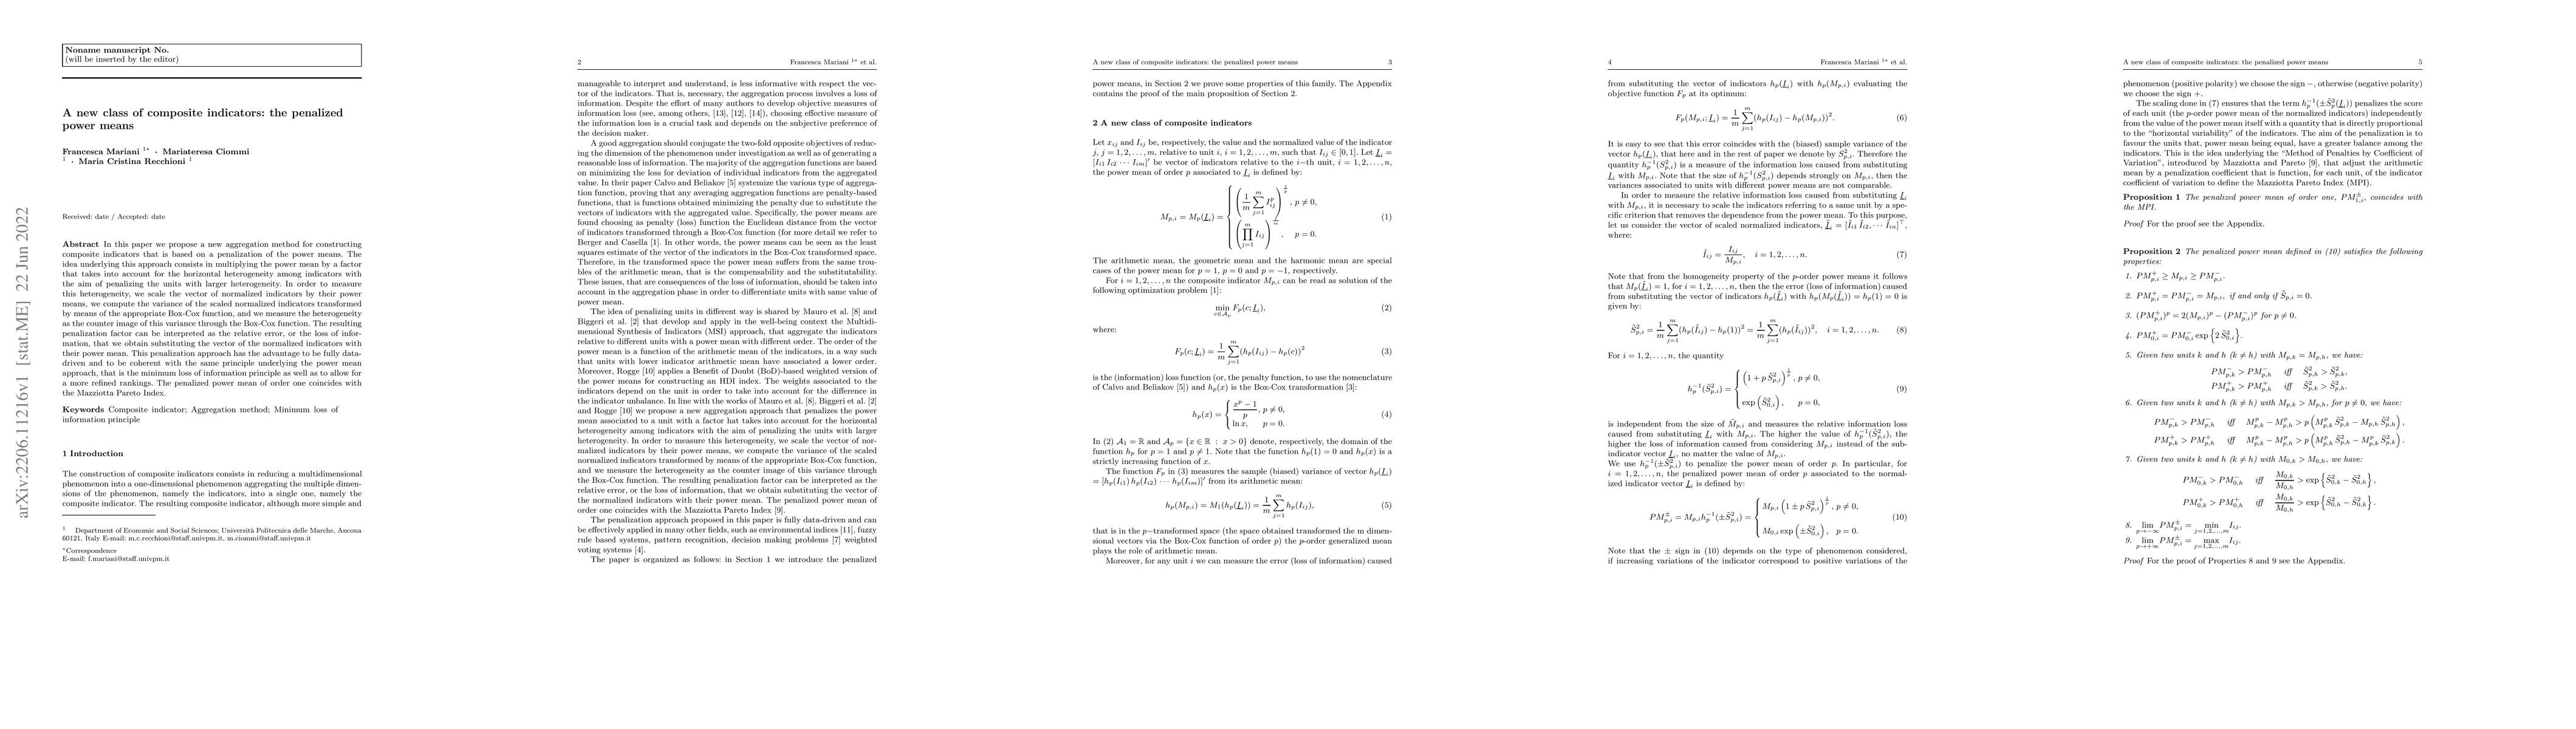
In this paper we propose a new aggregation method for constructing composite indicators that is based on a penalization of the power means. The idea underlying this approach consists in multiplying the power mean by a factor that takes into account for the horizontal heterogeneity among indicators with the aim of penalizing the units with larger heterogeneity. In order to measure this heterogeneity, we scale the vector of normalized indicators by their power means, we compute the variance of the scaled normalized indicators transformed by means of the appropriate Box-Cox function, and we measure the heterogeneity as the counter image of this variance through the Box-Cox function. The resulting penalization factor can be interpreted as the relative error, or the loss of information, that we obtain substituting the vector of the normalized indicators with their power mean. This penalization approach has the advantage to be fully data-driven and to be coherent with the same principle underlying the power mean approach, that is the minimum loss of information principle as well as to allow for a more refined rankings. The penalized power mean of order one coincides with the Mazziotta Pareto Index.
AI Key Findings
Get AI-generated insights about this paper's methodology, results, significance, and more — seven facets brought into focus.
Impact
Paper Details
Authors
PDF Preview
Key Terms
Citation Network
Current paper (gray), citations (green), references (blue)
Display is limited for performance on very large graphs.
Discussion 0