Publication
Metrics
AI Quick Summary
This paper proposes a new $p$-control chart with measurement error correction to monitor the proportion of non-conforming products. It introduces a corrected EWMA $p$-control chart with asymmetric control limits, which is effective even for small sample sizes and addresses biases caused by measurement errors.
Paper Preview
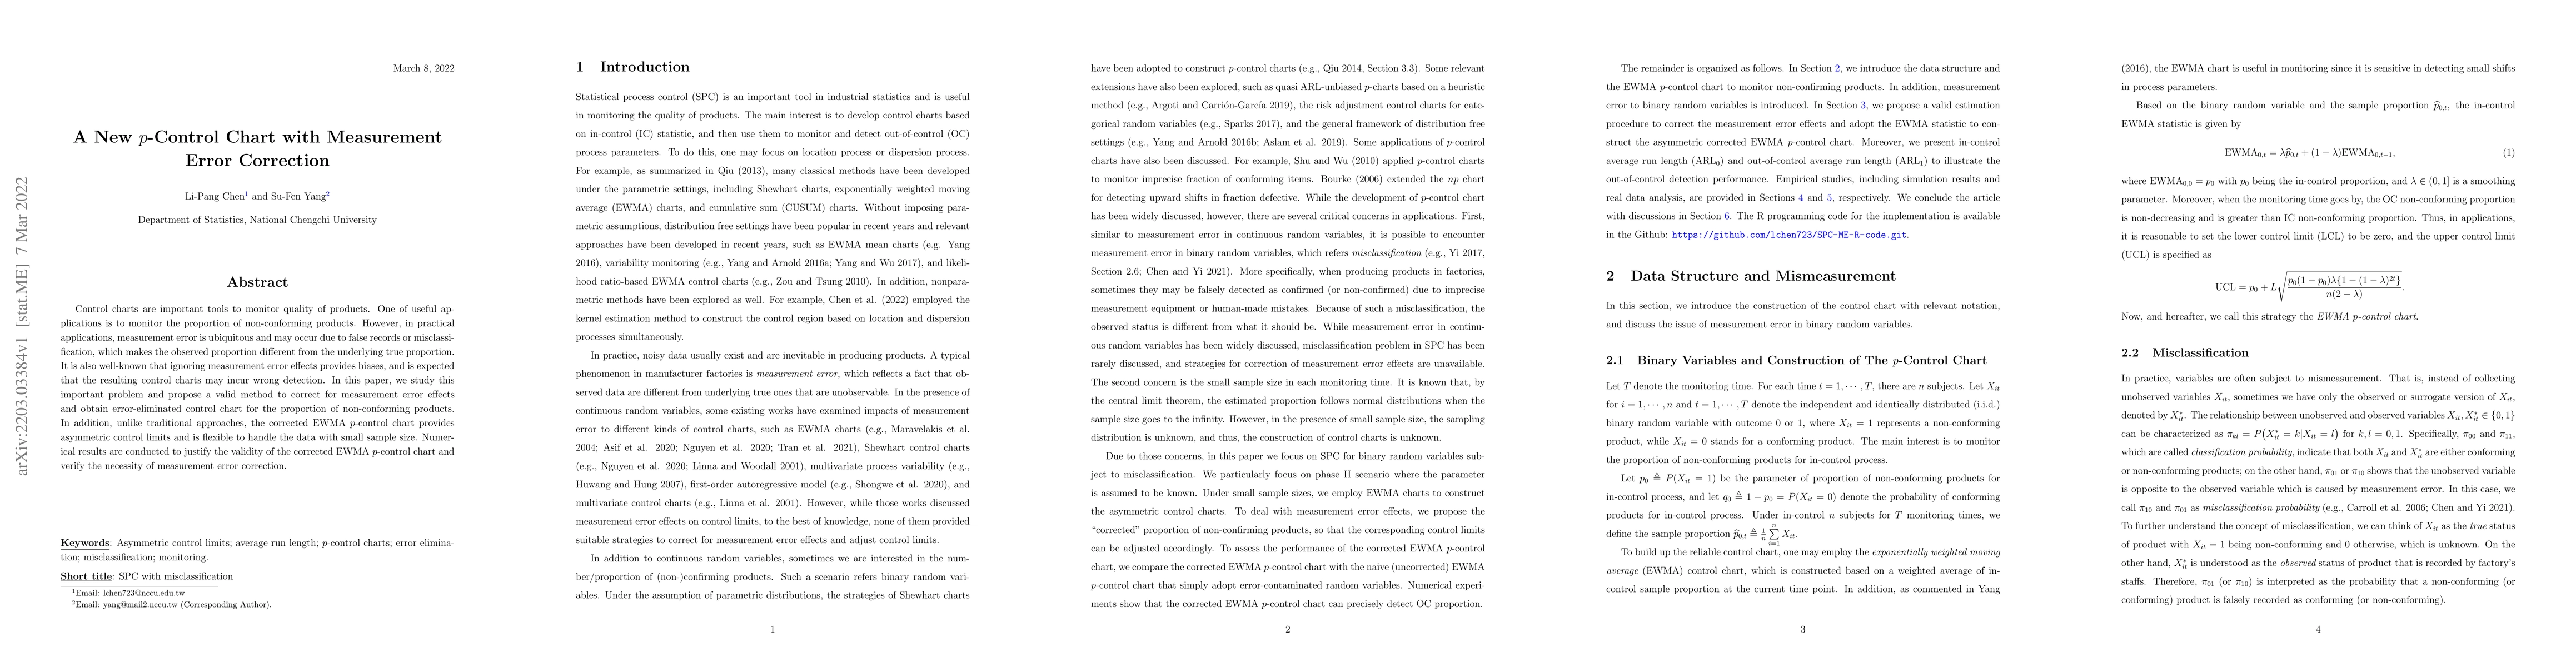
Abstract
Control charts are important tools to monitor quality of products. One of useful applications is to monitor the proportion of non-conforming products. However, in practical applications, measurement error is ubiquitous and may occur due to false records or misclassification, which makes the observed proportion different from the underlying true proportion. It is also well-known that ignoring measurement error effects provides biases, and is expected that the resulting control charts may incur wrong detection. In this paper, we study this important problem and propose a valid method to correct for measurement error effects and obtain error-eliminated control chart for the proportion of non-conforming products. In addition, unlike traditional approaches, the corrected EWMA $p$-control chart provides asymmetric control limits and is flexible to handle the data with small sample size. Numerical results are conducted to justify the validity of the corrected EWMA $p$-control chart and verify the necessity of measurement error correction.
AI Key Findings
Get AI-generated insights about this paper's methodology, results, significance, and more — seven facets brought into focus.
Impact
Paper Details
Authors
PDF Preview
Key Terms
Citation Network
Current paper (gray), citations (green), references (blue)
Display is limited for performance on very large graphs.
Discussion 0