A New Perspective on Drawing Venn Diagrams for Data Visualization
2601.06980
Published Jan 11, 2026
Publication
Published:
Jan 11, 2026
Categories:
cs.GR, cs.CG, math.CO
Metrics
Source:
ArXiv
Paper Preview
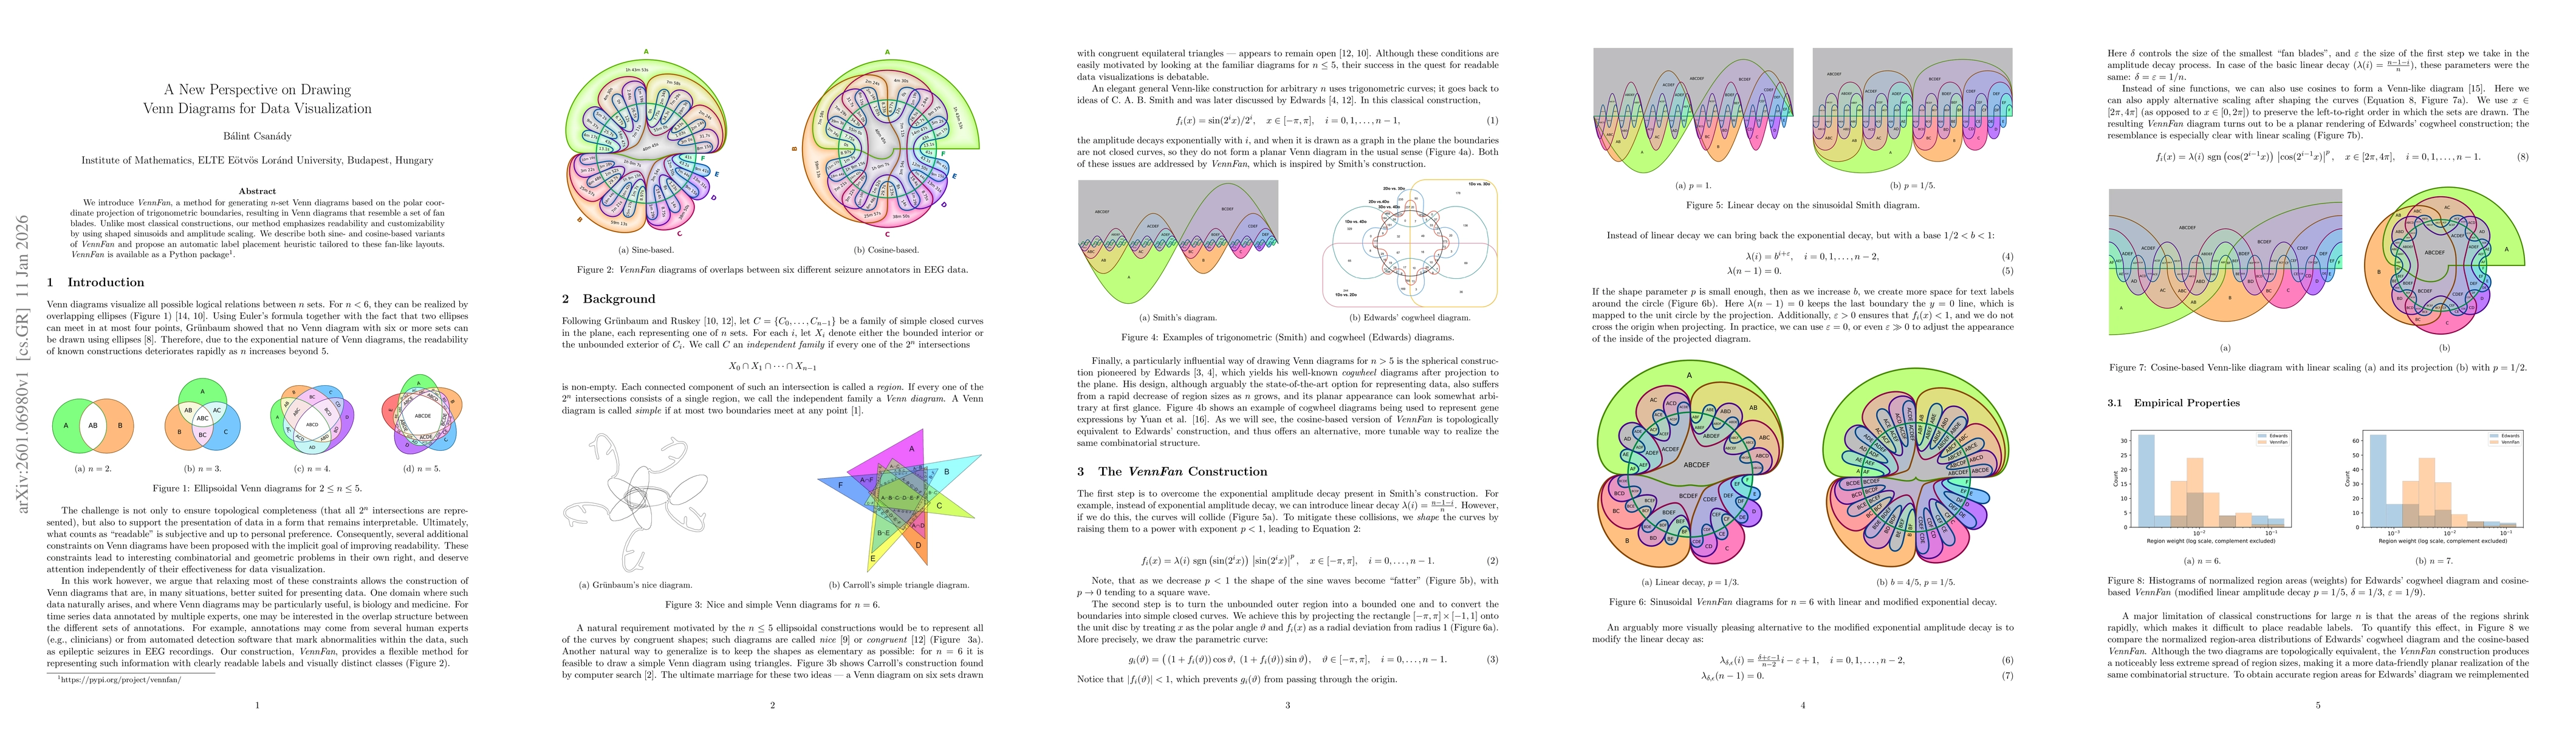
Abstract
We introduce VennFan, a method for generating $n$-set Venn diagrams based on the polar coordinate projection of trigonometric boundaries, resulting in Venn diagrams that resemble a set of fan blades. Unlike most classical constructions, our method emphasizes readability and customizability by using shaped sinusoids and amplitude scaling. We describe both sine- and cosine-based variants of VennFan and propose an automatic label placement heuristic tailored to these fan-like layouts. VennFan is available as a Python package (https://pypi.org/project/vennfan/).
AI Key Findings
Get AI-generated insights about this paper's methodology, results, significance, and more — seven facets brought into focus.
Paper Details
Paper ID:
2601.06980
Comments:
15 pages, 19 figures
Categories:
cs.GR
cs.CG
math.CO
Discussion 0