A new quantity for statistical analysis: "Scaling invariable Benford distance"
Publication
Metrics
AI Quick Summary
This paper introduces a new statistical measure called "Scaling invariable Benford distance" and a "Benford cyclic graph" for analyzing datasets. The study finds significant differences in these measures across various common distributions and observes that the distance stabilizes as data size increases.
Paper Preview
Abstract
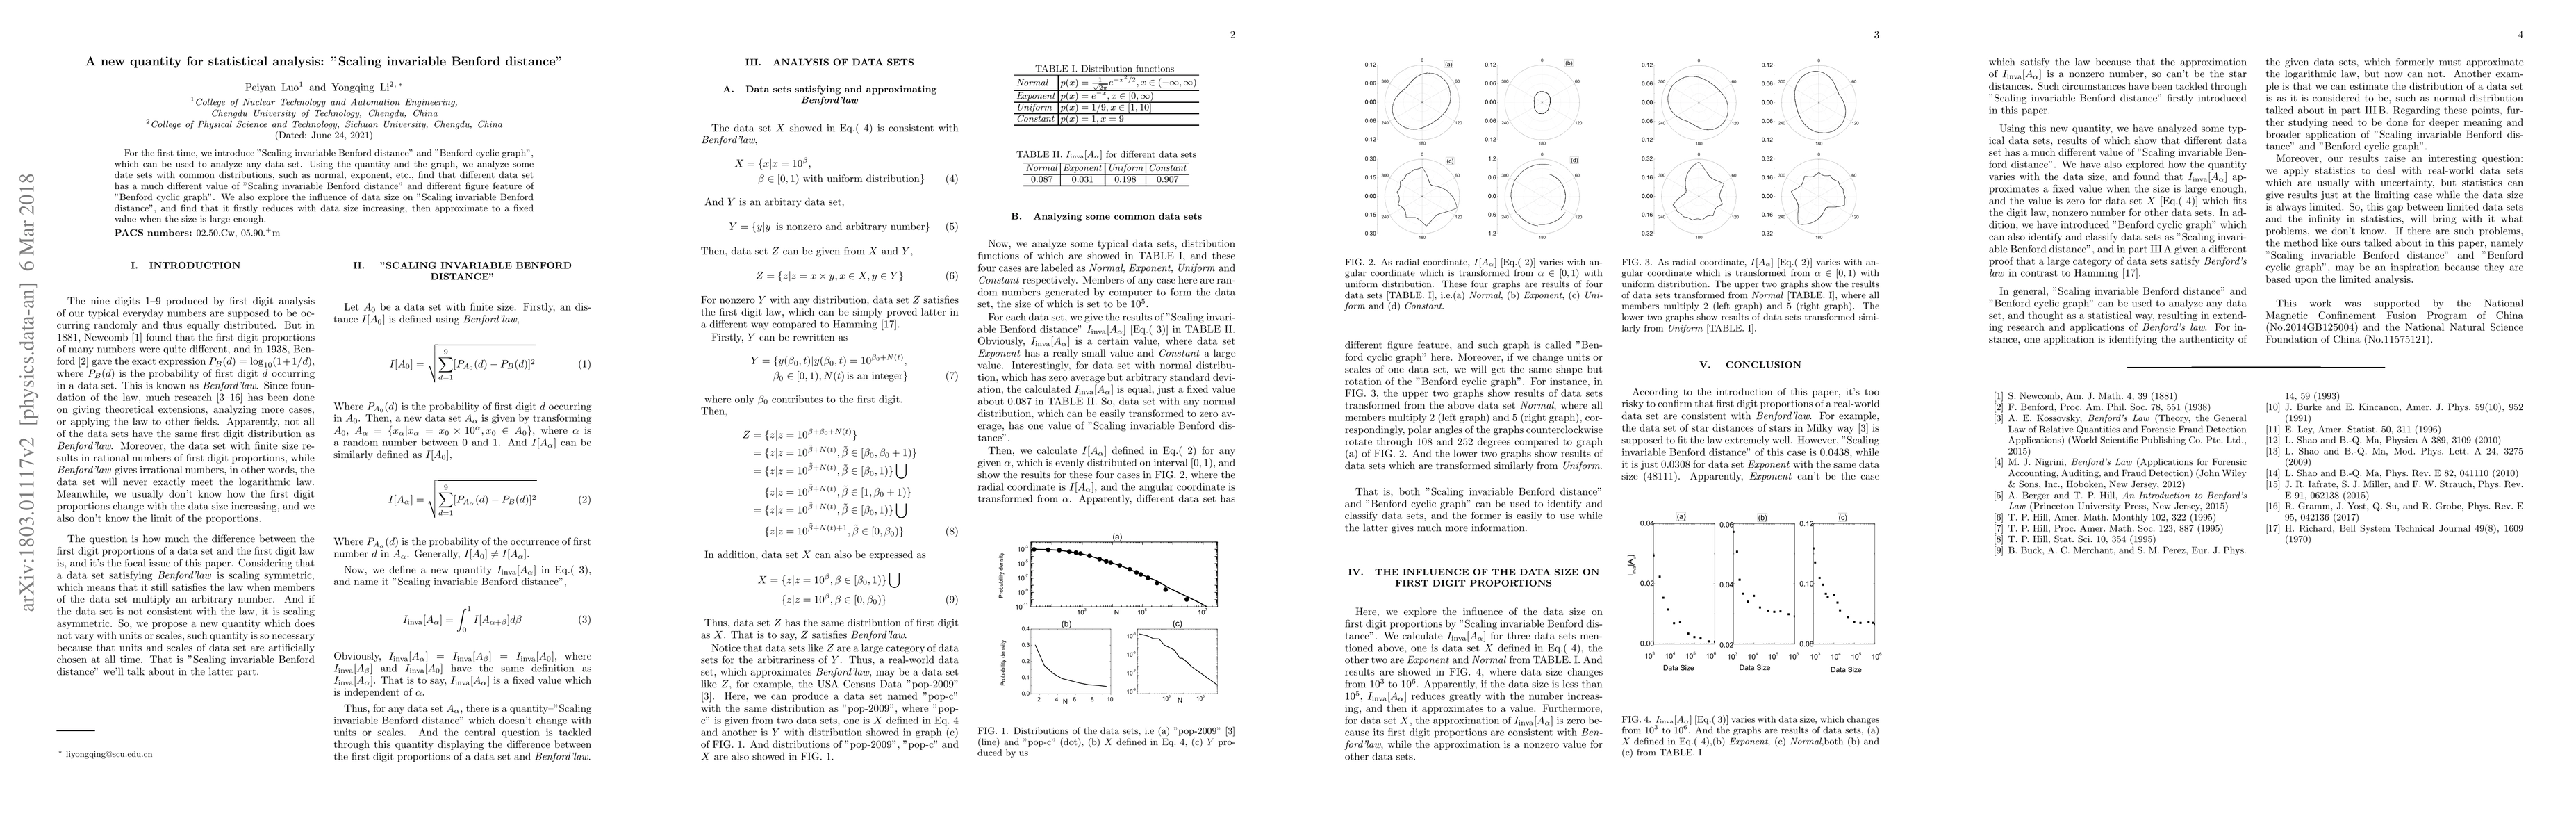
For the first time, we introduce "Scaling invariable Benford distance" and "Benford cyclic graph", which can be used to analyze any data set. Using the quantity and the graph, we analyze some date sets with common distributions, such as normal, exponent, etc., find that different data set has a much different value of "Scaling invariable Benford distance" and different figure feature of "Benford cyclic graph". We also explore the influence of data size on "Scaling invariable Benford distance", and find that it firstly reduces with data size increasing, then approximate to a fixed value when the size is large enough.
AI Key Findings
Get AI-generated insights about this paper's methodology, results, significance, and more — seven facets brought into focus.
Impact
Paper Details
PDF Preview
Key Terms
Citation Network
Current paper (gray), citations (green), references (blue)
Display is limited for performance on very large graphs.
Discussion 0