Summary
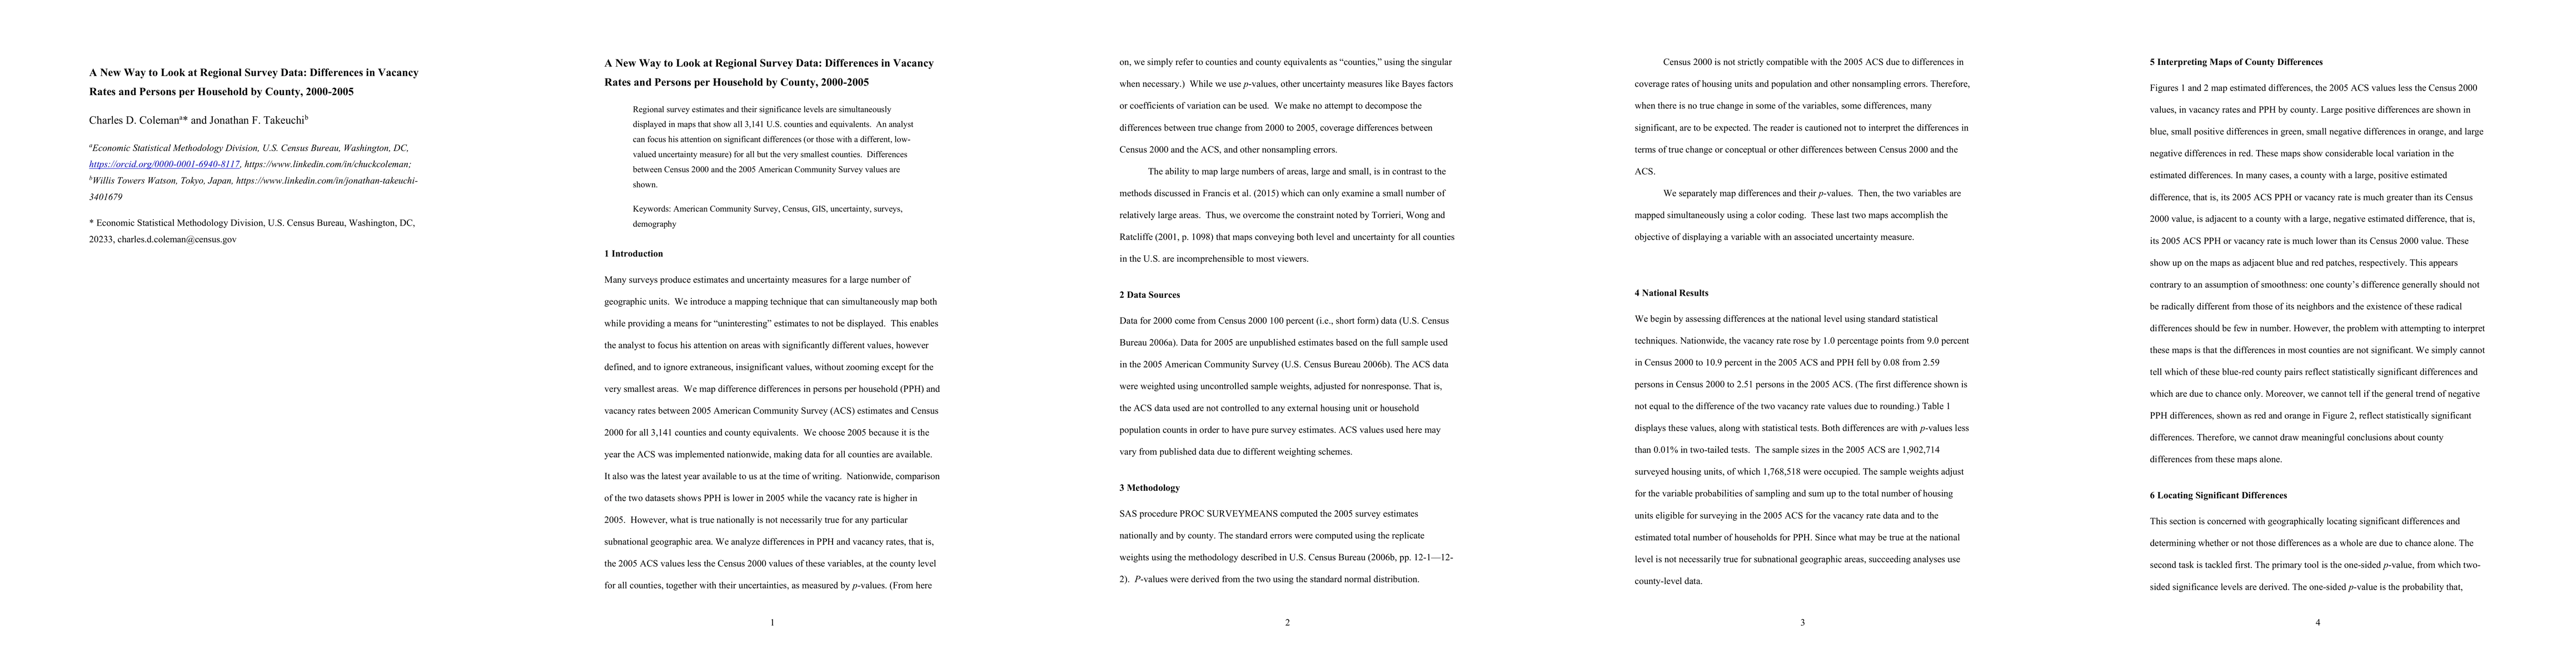
Regional survey estimates and their significance levels are simultaneously displayed in maps that show all 3,141 U.S. counties and equivalents. An analyst can focus his attention on significant differences (or those with a different, low-valued uncertainty measure) for all but the very smallest counties. Differences between Census 2000 and the 2005 American Community Survey values are shown.
AI Key Findings
Get AI-generated insights about this paper's methodology, results, and significance.
Paper Details
PDF Preview
Key Terms
differences
(0.374)
survey
(0.357)
smallest
(0.276)
significance
(0.252)
valued
(0.248)
community
(0.239)
levels
(0.226)
uncertainty
(0.224)
Citation Network
Current paper (gray), citations (green), references (blue)
Display is limited for performance on very large graphs.
Current Paper
Citations
References
Click to view
Similar Papers
Found 4 papersNo citations found for this paper.
Comments (0)