A Novel First-Order Autoregressive Moving Average Model to Analyze Discrete-Time Series Irregularly Observed
Publication
Metrics
AI Quick Summary
This paper introduces a novel first-order autoregressive moving average model for analyzing discrete-time series with irregular observations. The model is shown to be stationary and ergodic under Gaussianity, and Monte Carlo experiments demonstrate its effectiveness in reducing bias and error with larger sample sizes.
Paper Preview
Abstract
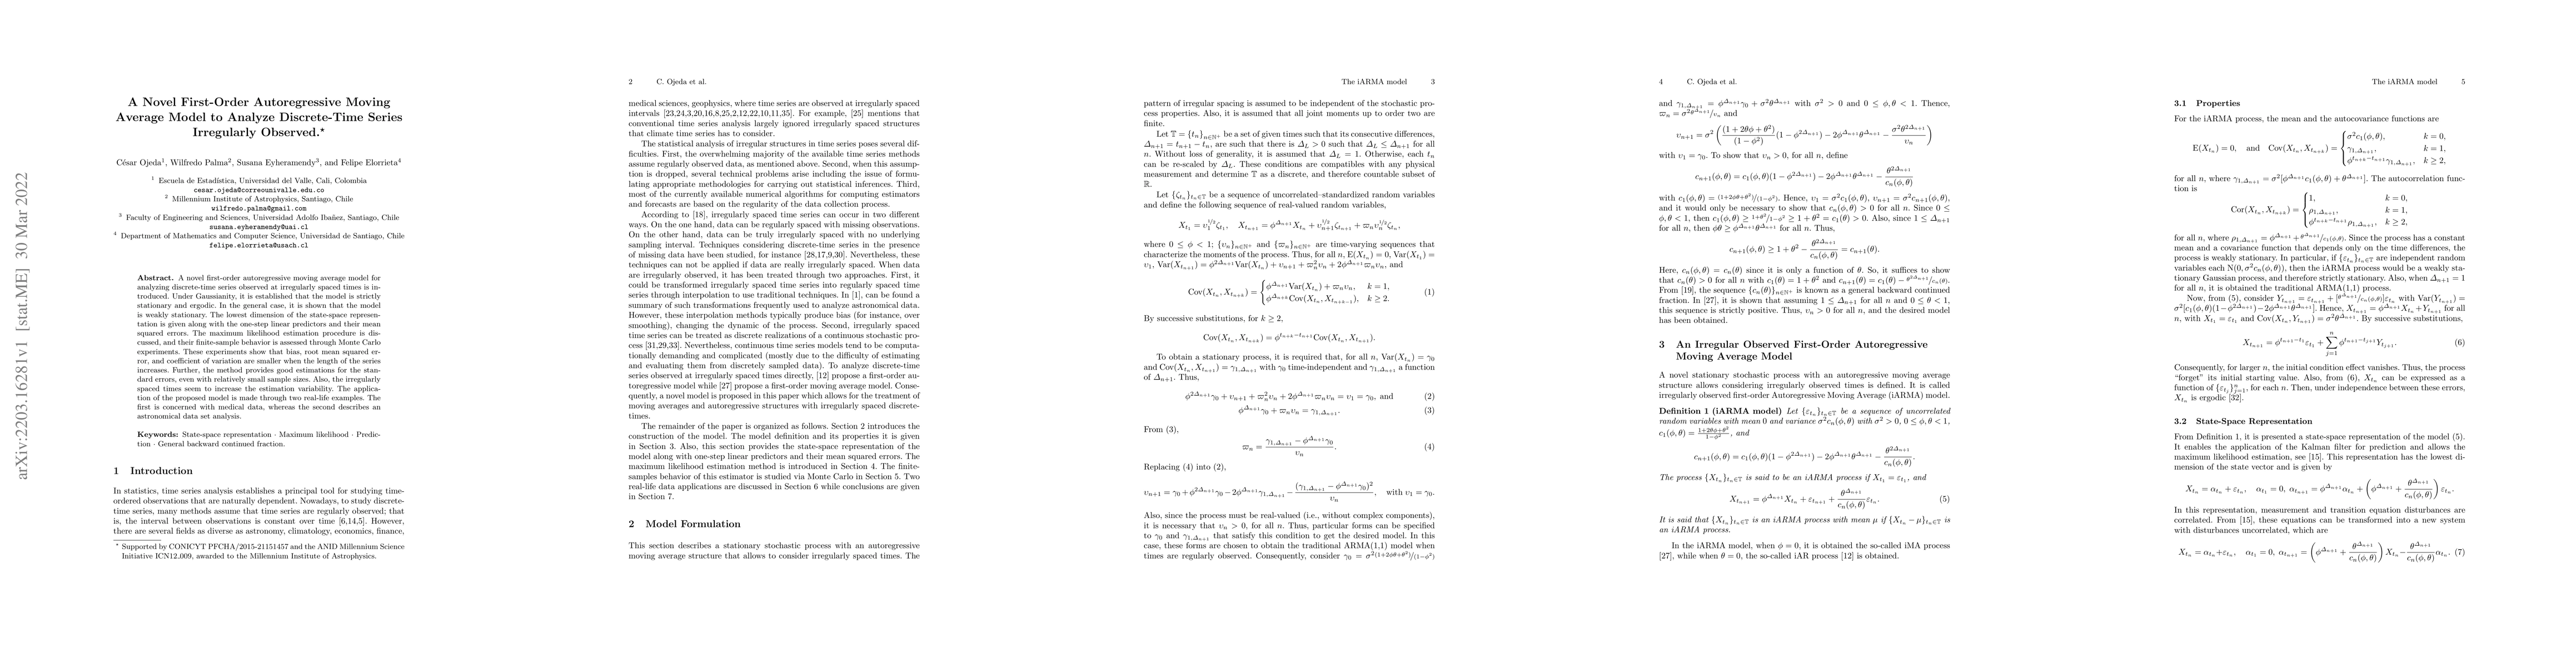
A novel first-order autoregressive moving average model for analyzing discrete-time series observed at irregularly spaced times is introduced. Under Gaussianity, it is established that the model is strictly stationary and ergodic. In the general case, it is shown that the model is weakly stationary. The lowest dimension of the state-space representation is given along with the one-step linear predictors and their mean squared errors. The maximum likelihood estimation procedure is discussed, and their finite-sample behavior is assessed through Monte Carlo experiments. These experiments show that bias, root mean squared error, and coefficient of variation are smaller when the length of the series increases. Further, the method provides good estimations for the standard errors, even with relatively small sample sizes. Also, the irregularly spaced times seem to increase the estimation variability. The application of the proposed model is made through two real-life examples. The first is concerned with medical data, whereas the second describes an astronomical data set analysis.
AI Key Findings
Get AI-generated insights about this paper's methodology, results, significance, and more — seven facets brought into focus.
Impact
Paper Details
Authors
PDF Preview
Key Terms
Citation Network
Current paper (gray), citations (green), references (blue)
Display is limited for performance on very large graphs.
Discussion 0