A Novel Method for ECG Signal Classification via One-Dimensional Convolutional Neural Network
Publication
Metrics
AI Quick Summary
This paper introduces a novel ECG signal classification method using 1D CNNs with a unique R-R-R segmentation strategy, achieving high accuracy (99.24% for 5 classes) and superior performance compared to existing methods. The method effectively segments ECG data for improved classification of heartbeat types.
Paper Preview
Abstract
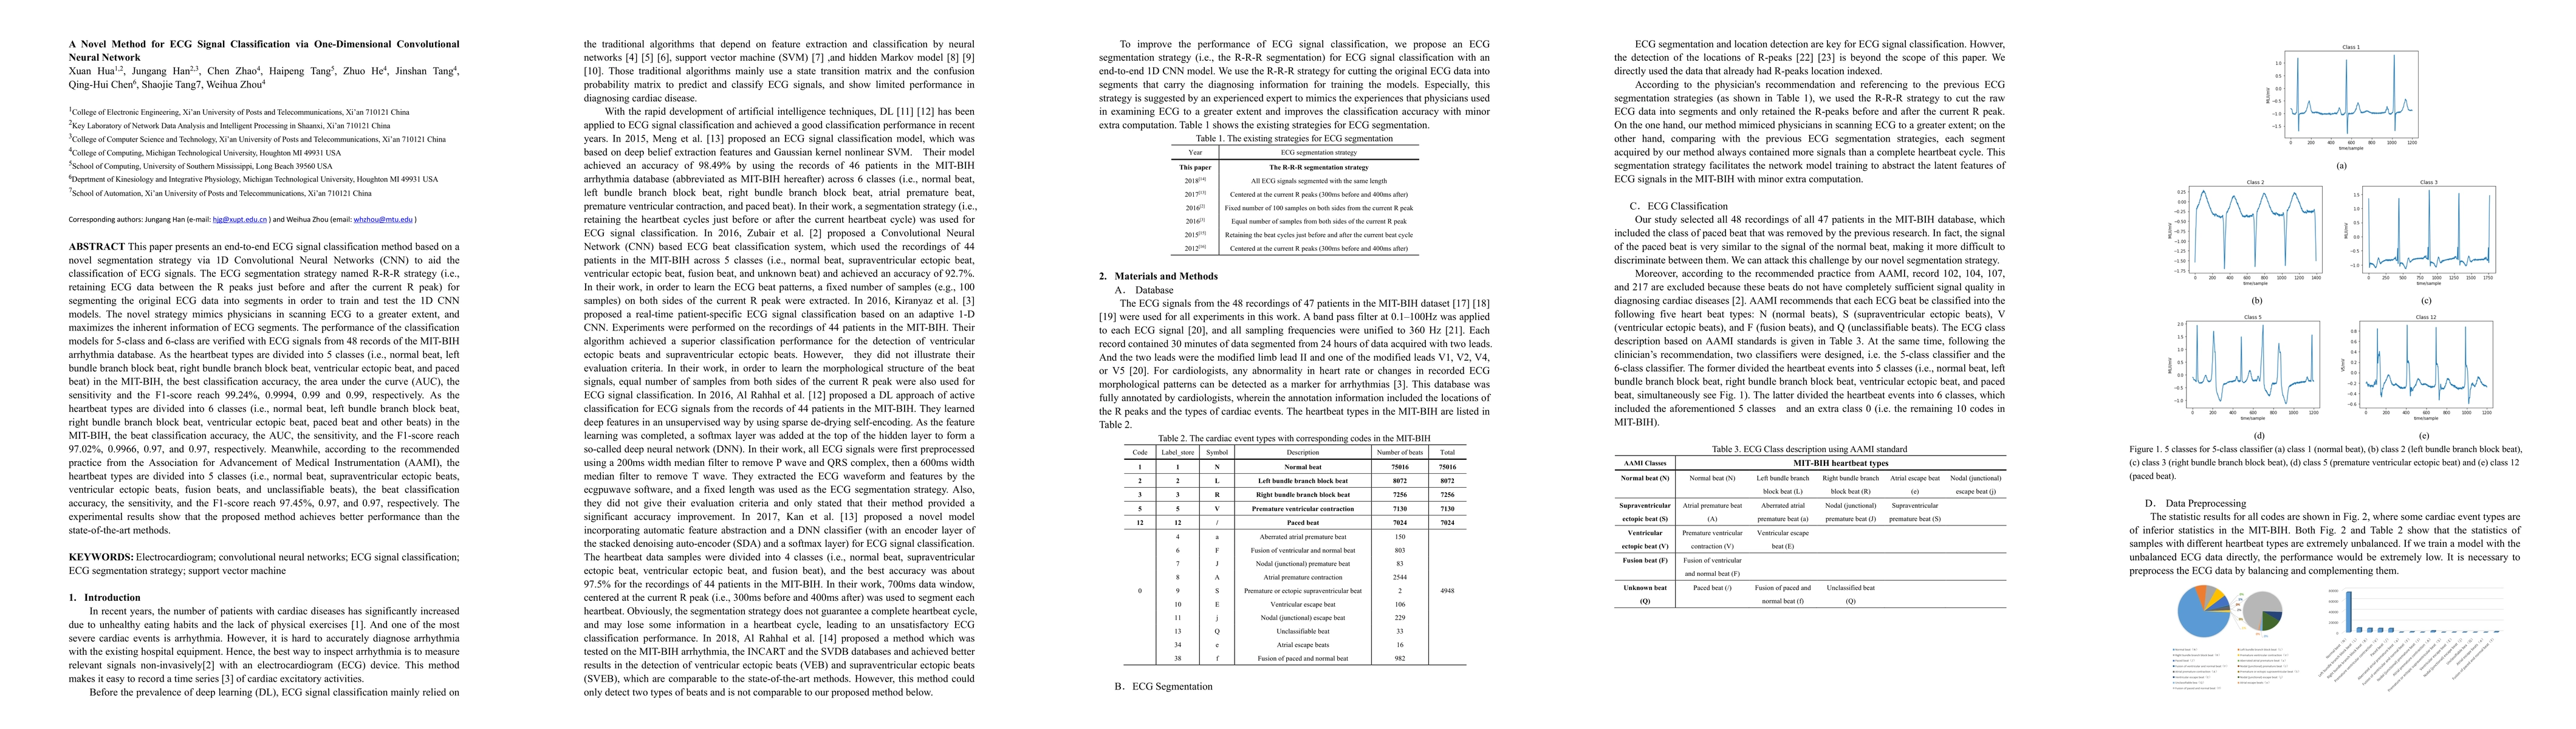
This paper presents an end-to-end ECG signal classification method based on a novel segmentation strategy via 1D Convolutional Neural Networks (CNN) to aid the classification of ECG signals. The ECG segmentation strategy named R-R-R strategy (i.e., retaining ECG data between the R peaks just before and after the current R peak) for segmenting the original ECG data into segments in order to train and test the 1D CNN models. The novel strategy mimics physicians in scanning ECG to a greater extent, and maximizes the inherent information of ECG segments. The performance of the classification models for 5-class and 6-class are verified with ECG signals from 48 records of the MIT-BIH arrhythmia database. As the heartbeat types are divided into 5 classes (i.e., normal beat, left bundle branch block beat, right bundle branch block beat, ventricular ectopic beat, and paced beat) in the MIT-BIH, the best classification accuracy, the area under the curve (AUC), the sensitivity and the F1-score reach 99.24%, 0.9994, 0.99 and 0.99, respectively. As the heartbeat types are divided into 6 classes (i.e., normal beat, left bundle branch block beat, right bundle branch block beat, ventricular ectopic beat, paced beat and other beats) in the MIT-BIH, the beat classification accuracy, the AUC, the sensitivity, and the F1-score reach 97.02%, 0.9966, 0.97, and 0.97, respectively. Meanwhile, according to the recommended practice from the Association for Advancement of Medical Instrumentation (AAMI), the heartbeat types are divided into 5 classes (i.e., normal beat, supraventricular ectopic beats, ventricular ectopic beats, fusion beats, and unclassifiable beats), the beat classification accuracy, the sensitivity, and the F1-score reach 97.45%, 0.97, and 0.97, respectively. The experimental results show that the proposed method achieves better performance than the state-of-the-art methods.
AI Key Findings
Get AI-generated insights about this paper's methodology, results, significance, and more — seven facets brought into focus.
Discussion 0