A one-way ANOVA test for functional data with graphical interpretation
Publication
Metrics
AI Quick Summary
This paper presents a novel one-way ANOVA test for functional data, offering graphical interpretation via a global envelope for function samples. The test, applicable in multidimensional ANOVA, identifies function domains causing rejection and facilitates post-hoc pair-wise group comparisons. It's demonstrated through an analysis of fiscal decentralization in European countries, revealing differences in government expenditure decentralization ratios across groups based on European integration history.
Paper Preview
Abstract
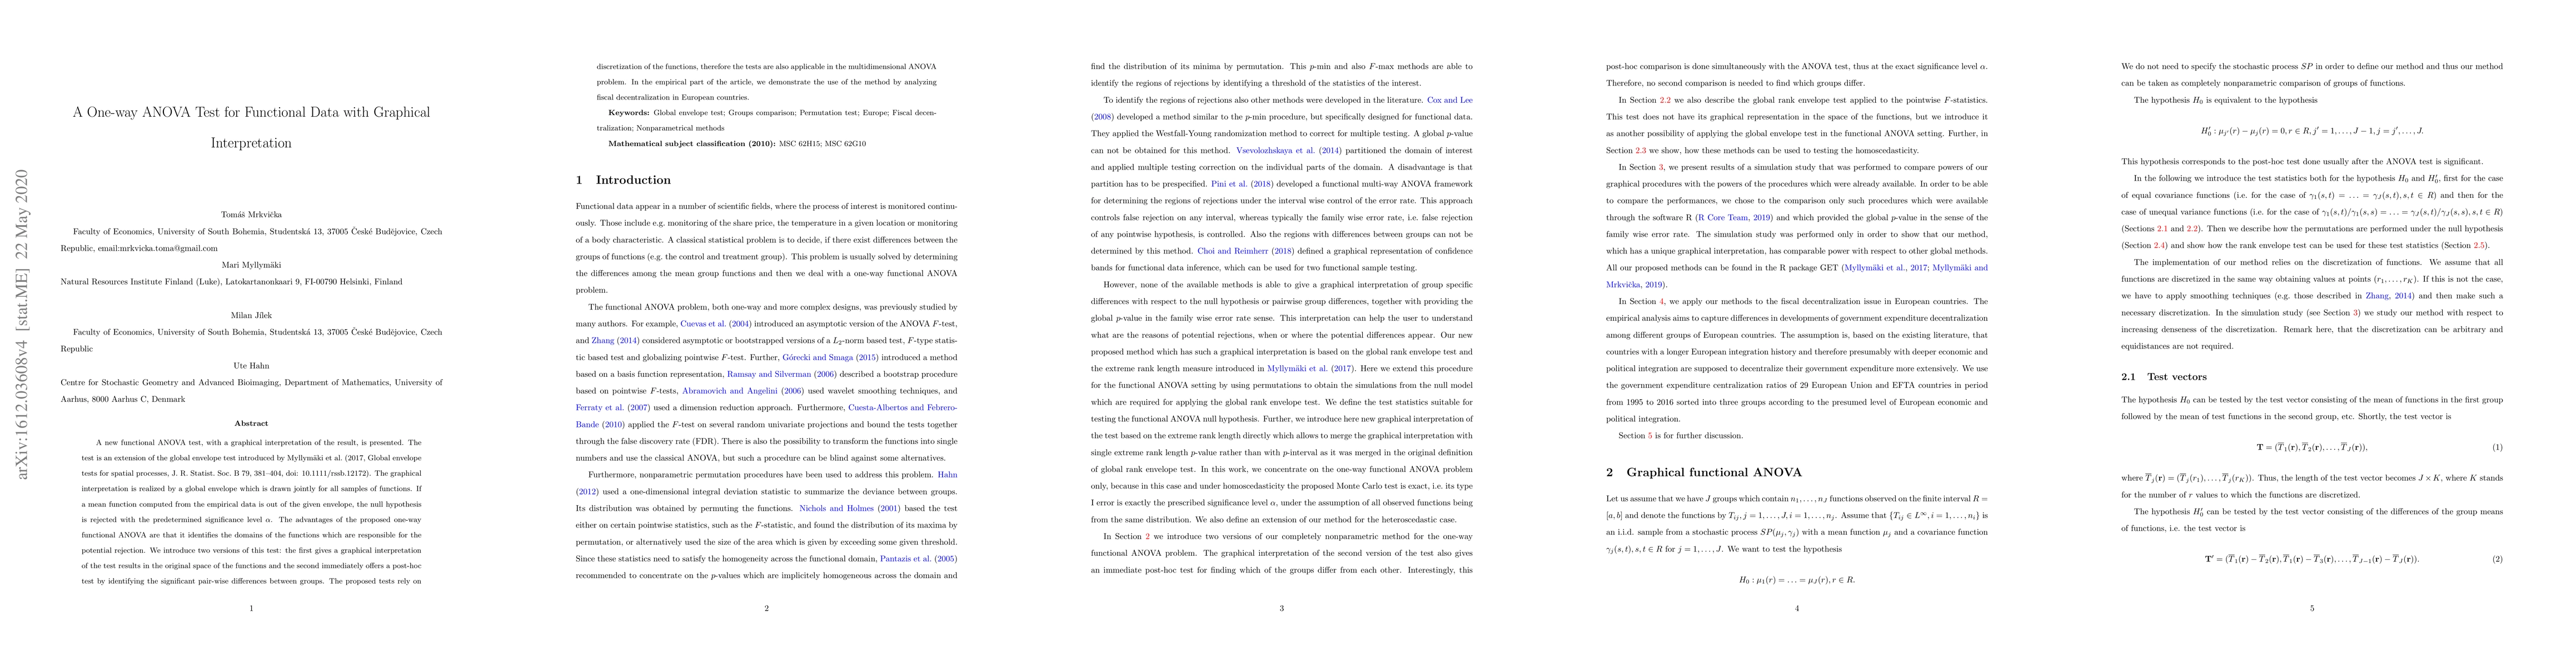
A new functional ANOVA test, with a graphical interpretation of the result, is presented. The test is an extension of the global envelope test introduced by Myllymaki et al. (2017, Global envelope tests for spatial processes, J. R. Statist. Soc. B 79, 381--404, doi: 10.1111/rssb.12172). The graphical interpretation is realized by a global envelope which is drawn jointly for all samples of functions. If a mean function computed from the empirical data is out of the given envelope, the null hypothesis is rejected with the predetermined significance level $\alpha$. The advantages of the proposed one-way functional ANOVA are that it identifies the domains of the functions which are responsible for the potential rejection. We introduce two versions of this test: the first gives a graphical interpretation of the test results in the original space of the functions and the second immediately offers a post-hoc test by identifying the significant pair-wise differences between groups. The proposed tests rely on discretization of the functions, therefore the tests are also applicable in the multidimensional ANOVA problem. In the empirical part of the article, we demonstrate the use of the method by analyzing fiscal decentralization in European countries. The aim of the empirical analysis is to capture differences between the levels of government expenditure decentralization ratio among different groups of European countries. The idea behind, based on the existing literature, is straightforward: countries with a longer European integration history are supposed to decentralize more of their government expenditure. We use the government expenditure centralization ratios of 29 European Union and EFTA countries in period from 1995 to 2016 sorted into three groups according to the presumed level of European economic and political integration.
AI Key Findings
Get AI-generated insights about this paper's methodology, results, significance, and more — seven facets brought into focus.
Impact
Paper Details
Authors
PDF Preview
Key Terms
Citation Network
Current paper (gray), citations (green), references (blue)
Display is limited for performance on very large graphs.
Discussion 0