A Personalized Predictive Model that Jointly Optimizes Discrimination and Calibration
Publication
Metrics
AI Quick Summary
This paper introduces an algorithm for creating personalized predictive models (PPMs) that jointly optimize both discrimination and calibration in precision medicine. It demonstrates that the size of a similar subpopulation significantly affects model performance, with calibration improving with subpopulation size in a quadratic relationship.
Paper Preview
Abstract
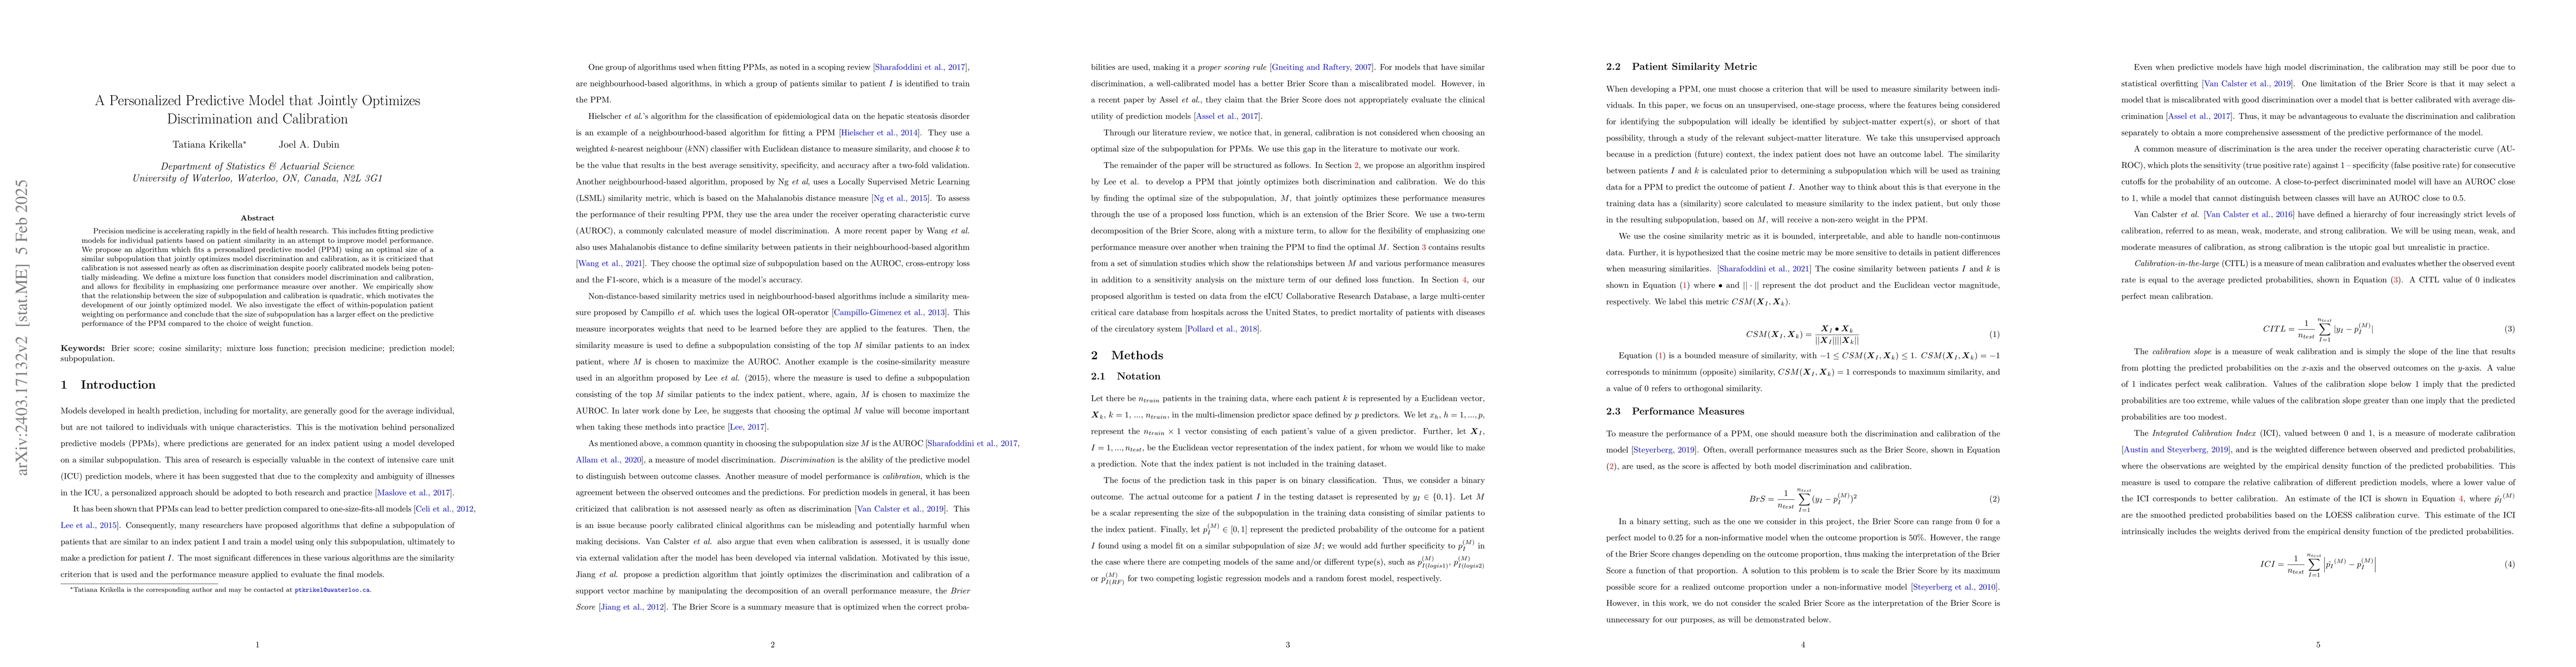
Precision medicine is accelerating rapidly in the field of health research. This includes fitting predictive models for individual patients based on patient similarity in an attempt to improve model performance. We propose an algorithm which fits a personalized predictive model (PPM) using an optimal size of a similar subpopulation that jointly optimizes model discrimination and calibration, as it is criticized that calibration is not assessed nearly as often as discrimination despite poorly calibrated models being potentially misleading. We define a mixture loss function that considers model discrimination and calibration, and allows for flexibility in emphasizing one performance measure over another. We empirically show that the relationship between the size of subpopulation and calibration is quadratic, which motivates the development of our jointly optimized model. We also investigate the effect of within-population patient weighting on performance and conclude that the size of subpopulation has a larger effect on the predictive performance of the PPM compared to the choice of weight function.
AI Key Findings
Get AI-generated insights about this paper's methodology, results, significance, and more — seven facets brought into focus.
Impact
Paper Details
Authors
PDF Preview
Key Terms
Citation Network
Current paper (gray), citations (green), references (blue)
Display is limited for performance on very large graphs.
Discussion 0