Summary
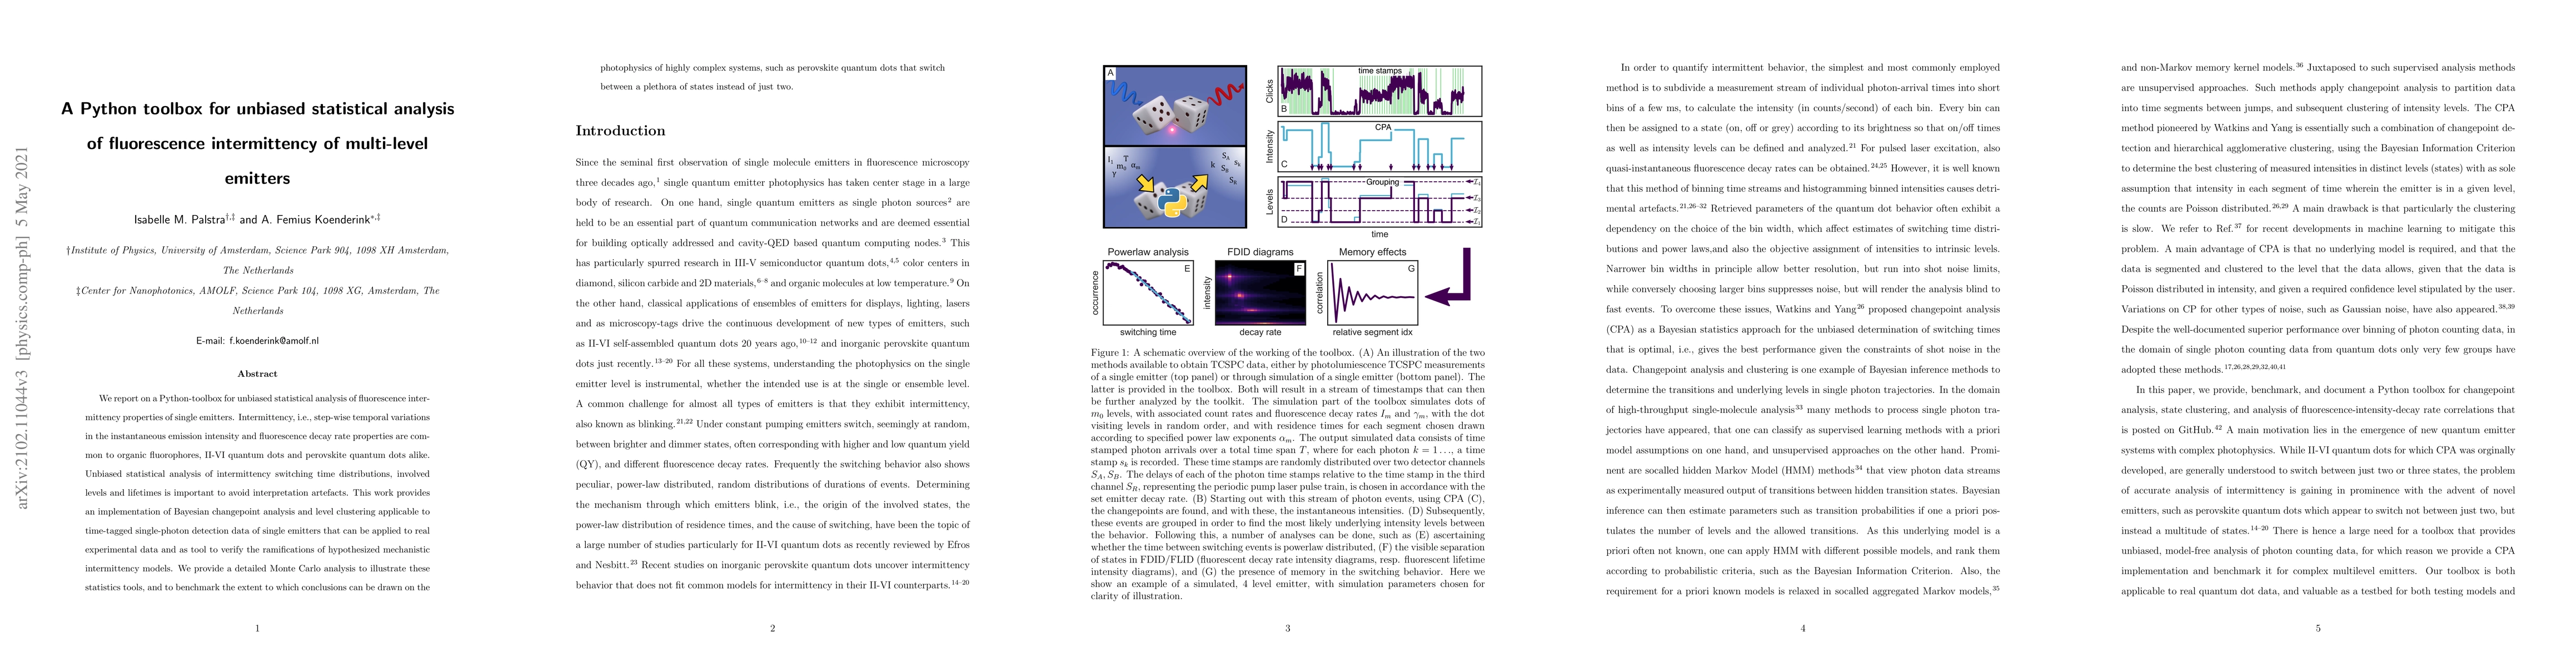
We report on a Python-toolbox for unbiased statistical analysis of fluorescence intermittency properties of single emitters. Intermittency, i.e., step-wise temporal variations in the instantaneous emission intensity and fluorescence decay rate properties are common to organic fluorophores, II-VI quantum dots and perovskite quantum dots alike. Unbiased statistical analysis of intermittency switching time distributions, involved levels and lifetimes is important to avoid interpretation artefacts. This work provides an implementation of Bayesian changepoint analysis and level clustering applicable to time-tagged single-photon detection data of single emitters that can be applied to real experimental data and as tool to verify the ramifications of hypothesized mechanistic intermittency models. We provide a detailed Monte Carlo analysis to illustrate these statistics tools, and to benchmark the extent to which conclusions can be drawn on the photophysics of highly complex systems, such as perovskite quantum dots that switch between a plethora of states instead of just two.
AI Key Findings
Get AI-generated insights about this paper's methodology, results, and significance.
Paper Details
PDF Preview
Key Terms
Citation Network
Current paper (gray), citations (green), references (blue)
Display is limited for performance on very large graphs.
Similar Papers
Found 4 papersA Python Toolbox for Representational Similarity Analysis
Peters, B., Taylor, J., van den Bosch, J. J. et al.
osl-ephys: A Python toolbox for the analysis of electrophysiology data
Mats W. J. van Es, Mark W. Woolrich, Chetan Gohil et al.
pyPCG: A Python Toolbox Specialized for Phonocardiography Analysis
Kristóf Müller, Janka Hatvani, Miklós Koller et al.
| Title | Authors | Year | Actions |
|---|
Comments (0)