A Q-Q plot aids interpretation of the False Discovery Rate
2109.02118
Published Sep 7, 2021
5 citations
Publication
Published:
Sep 07, 2021
Updated:
Jun 10, 2025
Categories:
stat.ME
Metrics
Citations:
5
Source:
ArXiv
AI Quick Summary
A new method uses Q-Q plots to visualize false discovery rates, aiding in understanding and interpreting FDR values.
Paper Preview
Abstract
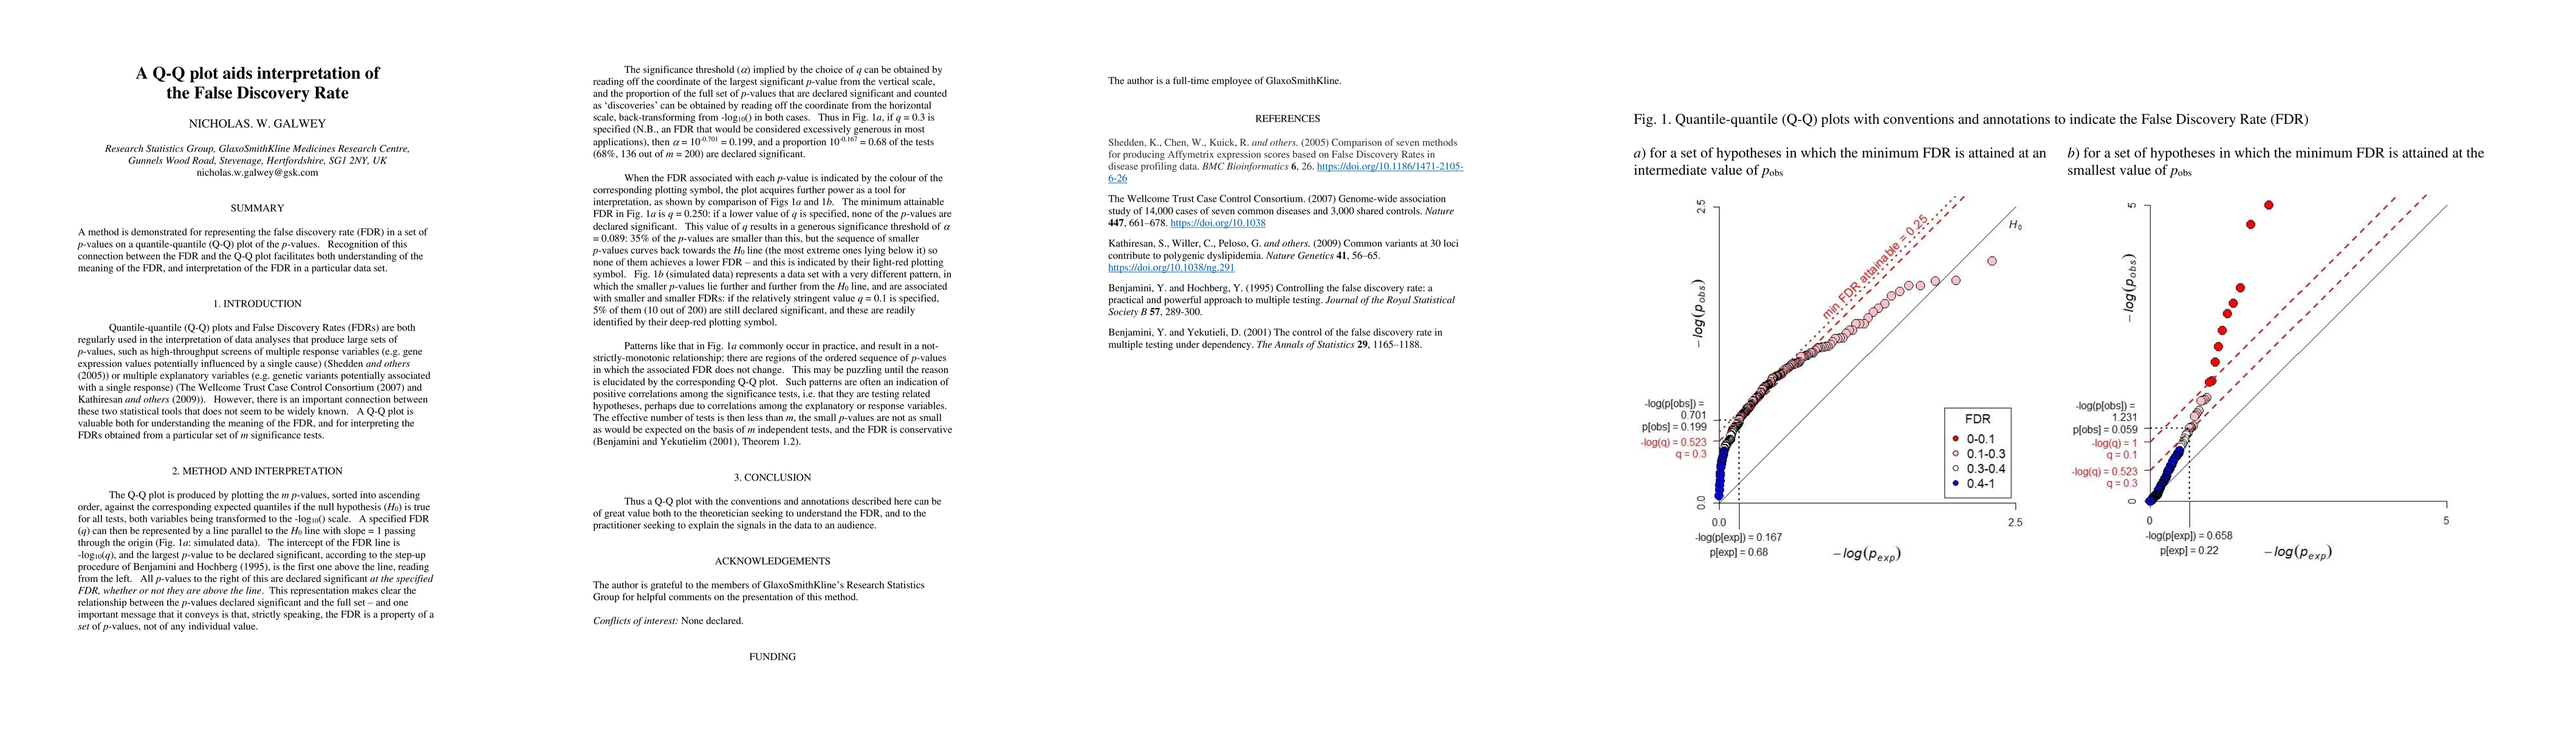
A method is demonstrated for representing the false discovery rate (FDR) in a set of p-values on a quantile-quantile (Q-Q) plot of the p-values. Recognition of this connection between the FDR and the Q-Q plot facilitates both understanding of the meaning of the FDR, and interpretation of the FDR in a particular data set.
AI Key Findings
Get AI-generated insights about this paper's methodology, results, significance, and more — seven facets brought into focus.
Impact
5
Citations
10
References
2
Influential
Paper Details
Paper ID:
2109.02118
License:
http://creativecommons.org/licenses/by/4.0/
Comments:
I initially submitted this manuscript to bioRxiv, but received a
response as follows: manuscript inappropriate for bioRxiv. ... might be
better suited to arXiv. Therefore I am submitting the manuscript to arXiv. I
guess that the manuscript was judged inappropriate for bioRxiv because it has
no explicit biological content, though method presented is widely applicable
in biology
Categories:
stat.ME
Authors
PDF Preview
Key Terms
values
(0.311)
meaning
(0.303)
facilitates
(0.301)
false
(0.290)
representing
(0.283)
data set
(0.277)
set
(0.268)
discovery
(0.248)
Citation Network
Current paper (gray), citations (green), references (blue)
Display is limited for performance on very large graphs.
Current Paper
Citations
References
Click to view
Discussion 0