Publication
Metrics
AI Quick Summary
This paper introduces a new quality metric for evaluating how well a graph visualization represents its cluster structure. Experiments show that the proposed metric effectively distinguishes variations in cluster visualization quality, and its application reveals that specialized graph drawing algorithms outperform others in visualizing cluster structures.
Paper Preview
Abstract
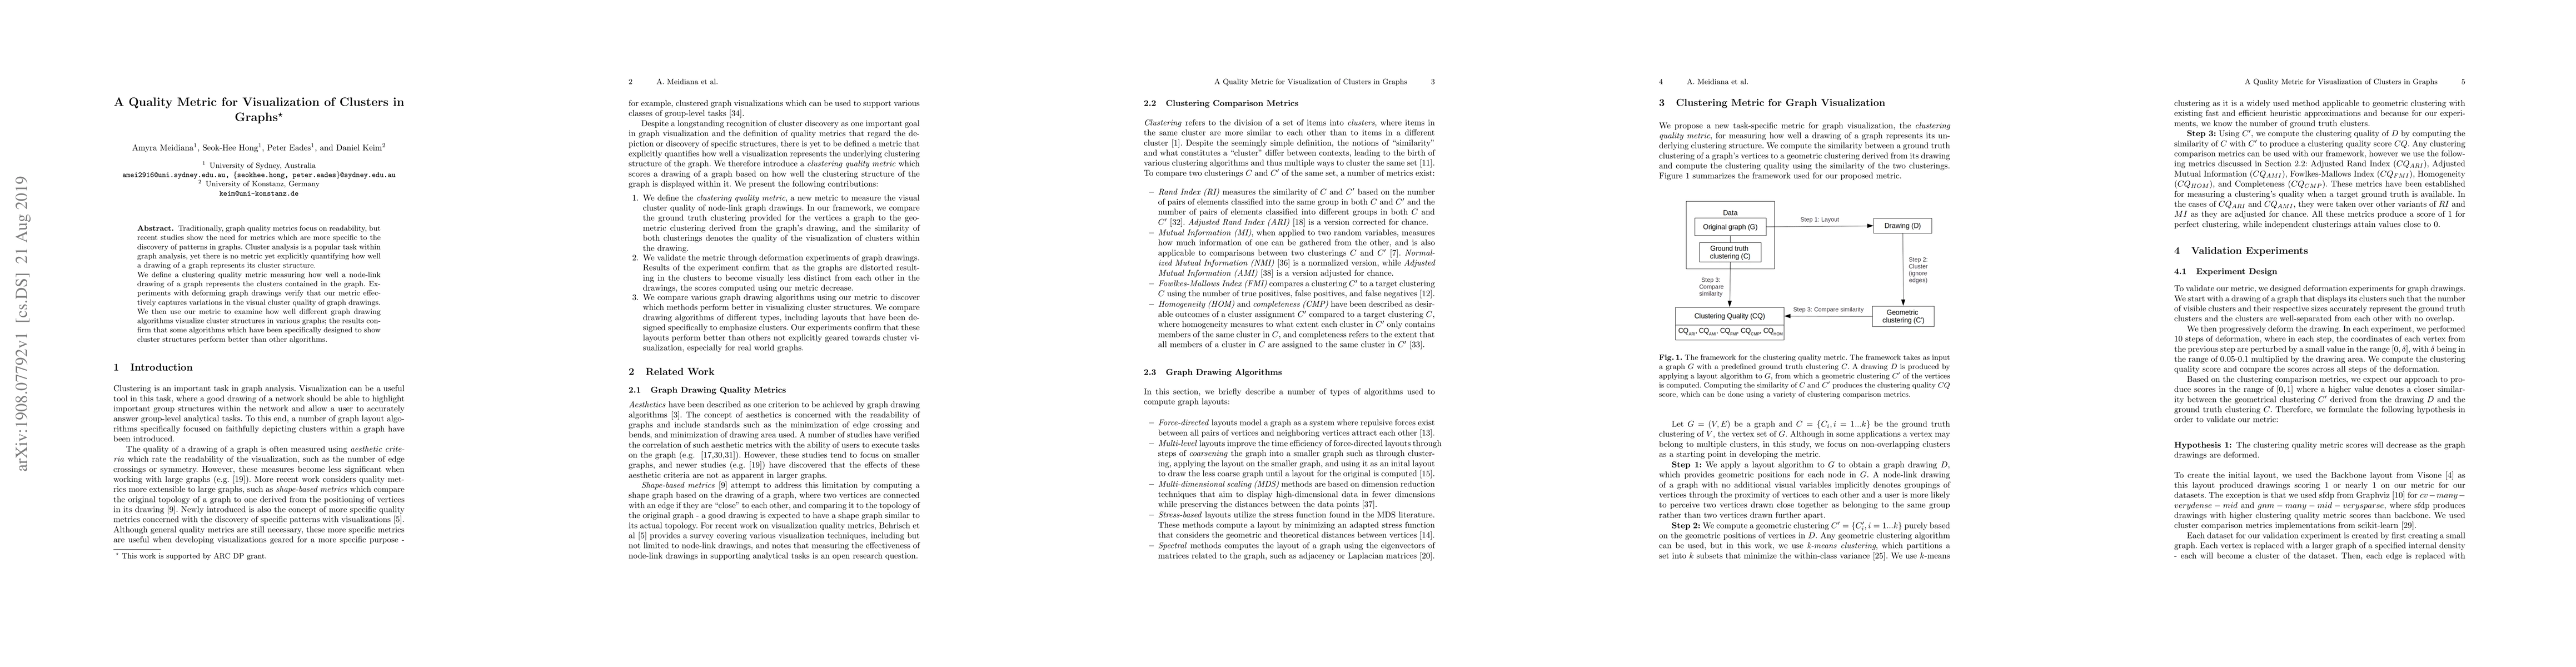
Traditionally, graph quality metrics focus on readability, but recent studies show the need for metrics which are more specific to the discovery of patterns in graphs. Cluster analysis is a popular task within graph analysis, yet there is no metric yet explicitly quantifying how well a drawing of a graph represents its cluster structure. We define a clustering quality metric measuring how well a node-link drawing of a graph represents the clusters contained in the graph. Experiments with deforming graph drawings verify that our metric effectively captures variations in the visual cluster quality of graph drawings. We then use our metric to examine how well different graph drawing algorithms visualize cluster structures in various graphs; the results con-firm that some algorithms which have been specifically designed to show cluster structures perform better than other algorithms.
AI Key Findings
Get AI-generated insights about this paper's methodology, results, significance, and more — seven facets brought into focus.
Impact
Paper Details
Authors
PDF Preview
Key Terms
Citation Network
Current paper (gray), citations (green), references (blue)
Display is limited for performance on very large graphs.
Discussion 0