A robust nonlinear mixed-effects model for COVID-19 deaths data
Publication
Metrics
AI Quick Summary
This paper presents a robust nonlinear mixed-effects model using scale mixtures of skew-normal distributions to analyze COVID-19 deaths data, addressing challenges such as similarly-shaped profiles with varying decay patterns, unexplained variation among repeated measurements within countries, and skewness or outliers in response variables. The model employs an efficient EM-type algorithm for parameter estimation and bootstrap for assessing individual profile characteristics. The study models death curves from Latin American countries, with additional European and North American data for comparison, aiming to provide a comprehensive analysis of the pandemic's progression.
Paper Preview
Abstract
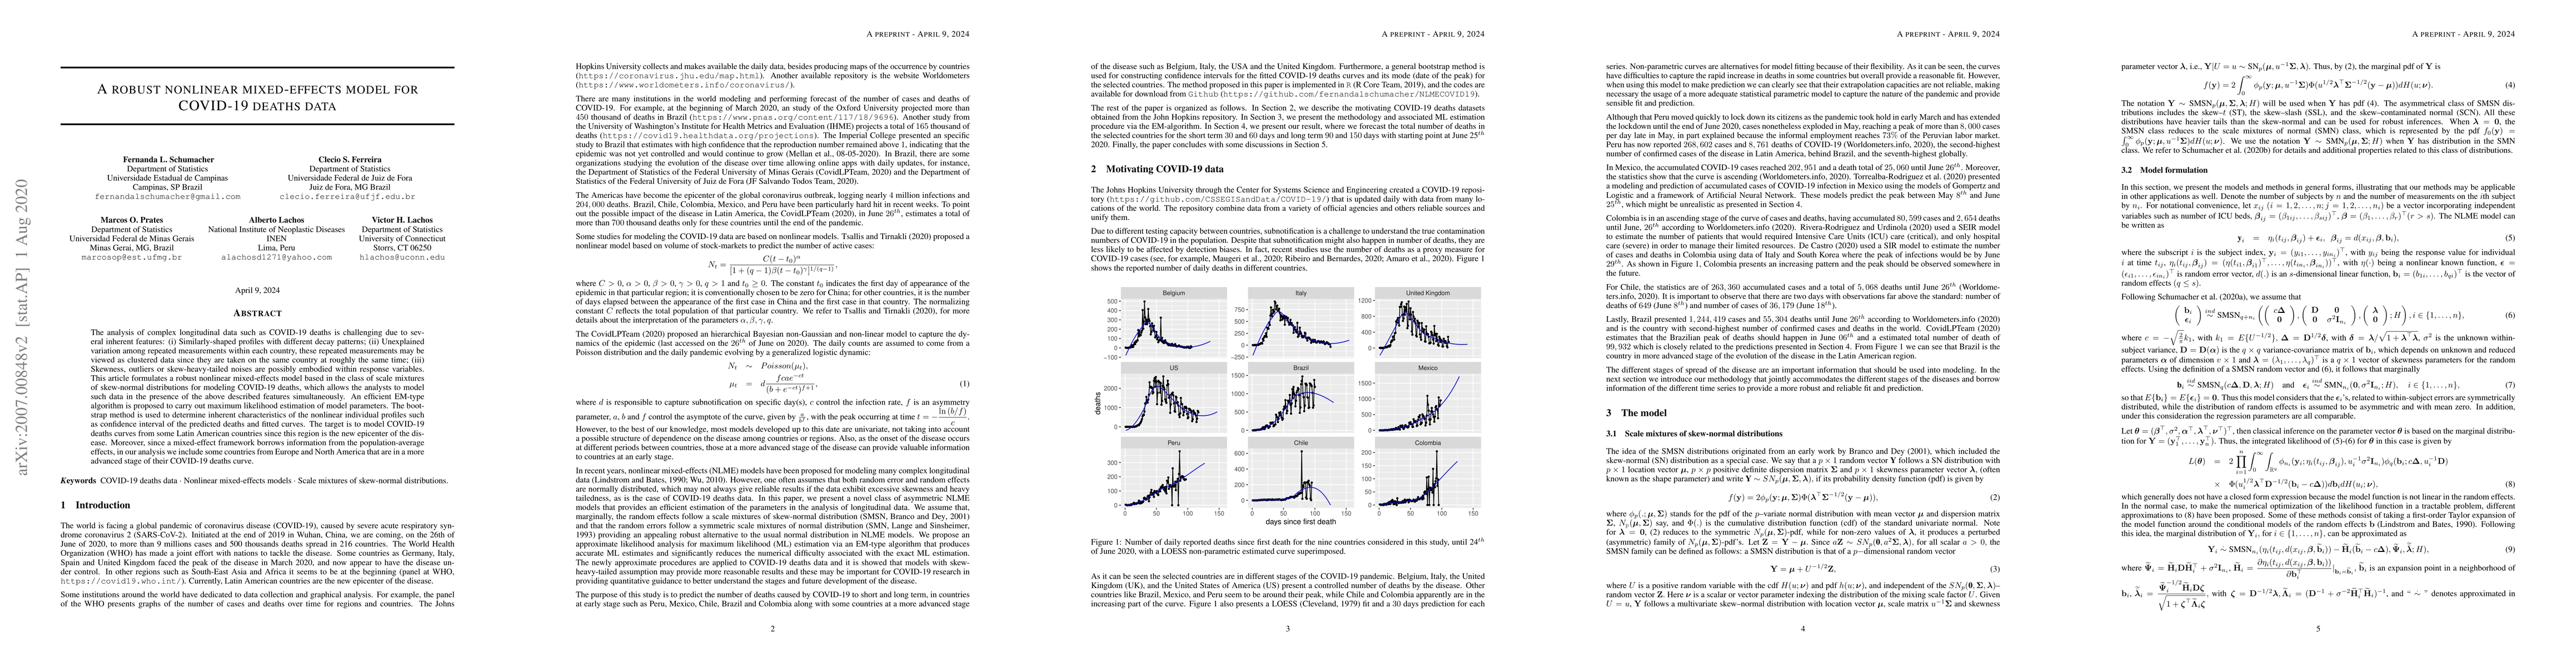
The analysis of complex longitudinal data such as COVID-19 deaths is challenging due to several inherent features: (i) Similarly-shaped profiles with different decay patterns; (ii) Unexplained variation among repeated measurements within each country, these repeated measurements may be viewed as clustered data since they are taken on the same country at roughly the same time; (iii) Skewness, outliers or skew-heavy-tailed noises are possibly embodied within response variables. This article formulates a robust nonlinear mixed-effects model based in the class of scale mixtures of skew-normal distributions for modeling COVID-19 deaths, which allows the analysts to model such data in the presence of the above described features simultaneously. An efficient EM-type algorithm is proposed to carry out maximum likelihood estimation of model parameters. The bootstrap method is used to determine inherent characteristics of the nonlinear individual profiles such as confidence interval of the predicted deaths and fitted curves. The target is to model COVID-19 deaths curves from some Latin American countries since this region is the new epicenter of the disease. Moreover, since a mixed-effect framework borrows information from the population-average effects, in our analysis we include some countries from Europe and North America that are in a more advanced stage of their COVID-19 deaths curve.
AI Key Findings
Get AI-generated insights about this paper's methodology, results, significance, and more — seven facets brought into focus.
Impact
Paper Details
Authors
PDF Preview
Key Terms
Citation Network
Current paper (gray), citations (green), references (blue)
Display is limited for performance on very large graphs.
Discussion 0