Publication
Metrics
AI Quick Summary
This paper introduces an initial implementation of the Roofline Toolkit's visualization framework, focusing on visualizing roofline charts and managing performance analysis data. The system integrates with the Eclipse IDE, aiming to facilitate performance modeling and optimization on various architectures.
Paper Preview
Abstract
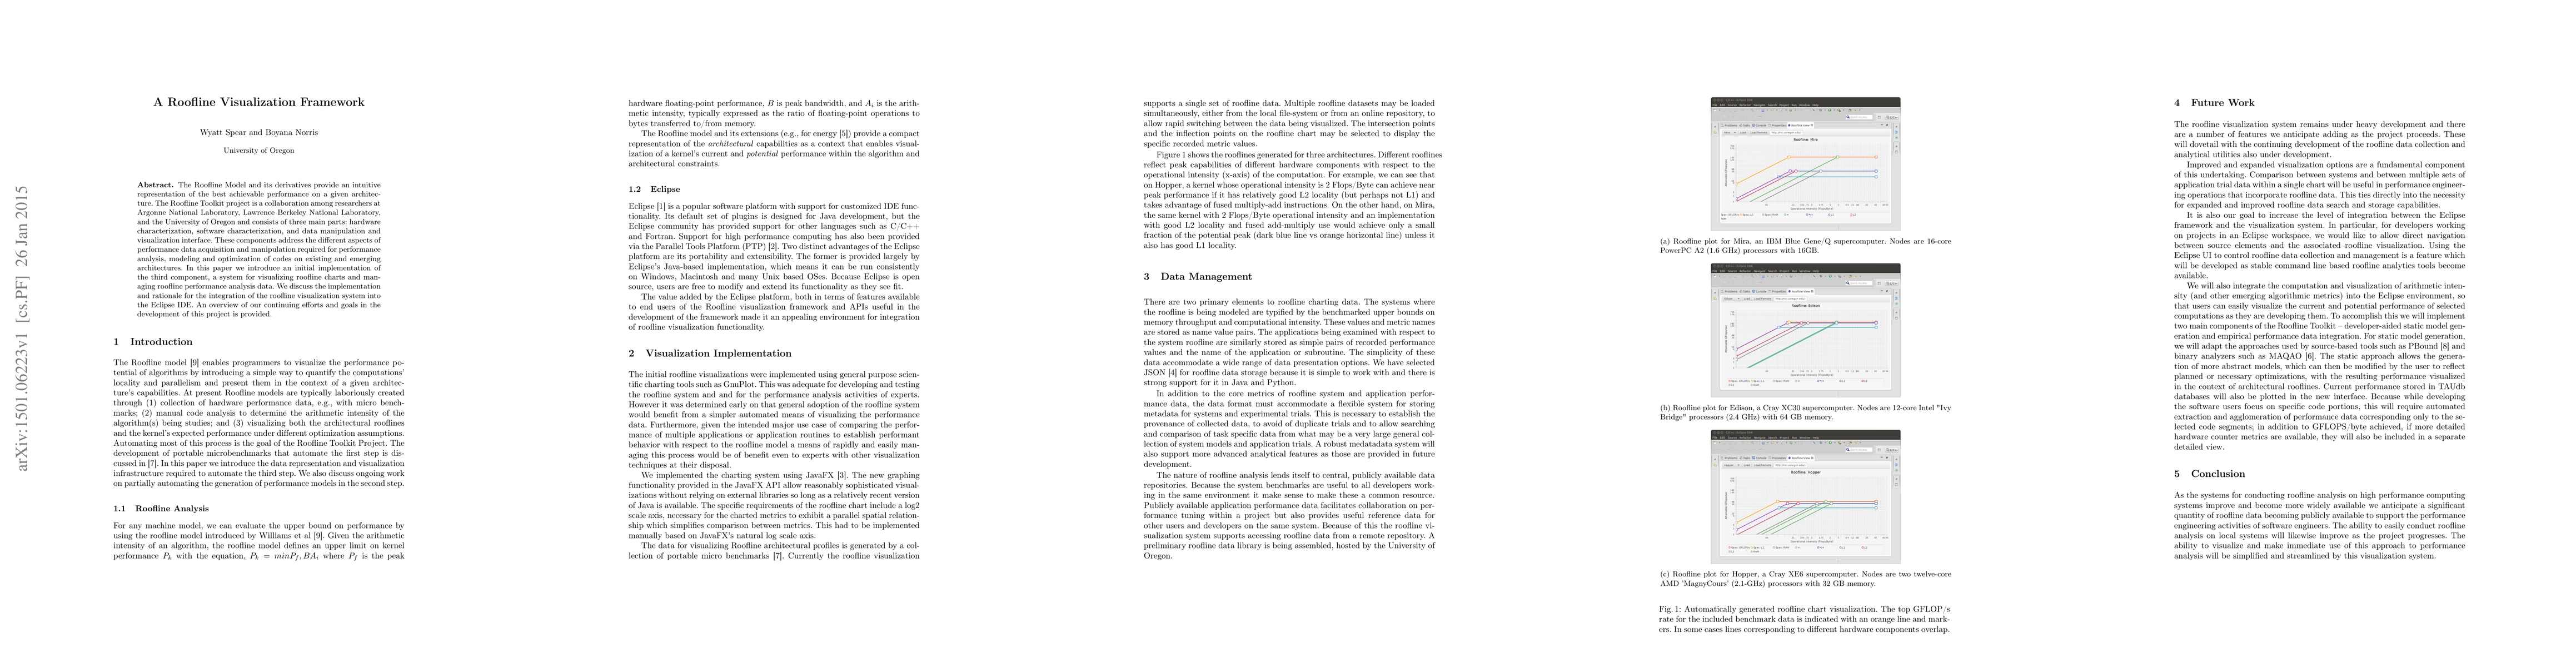
The Roofline Model and its derivatives provide an intuitive representation of the best achievable performance on a given architecture. The Roofline Toolkit project is a collaboration among researchers at Argonne National Laboratory, Lawrence Berkeley National Laboratory, and the University of Oregon and consists of three main parts: hardware characterization, software characterization, and data manipulation and visualization interface. These components address the different aspects of performance data acquisition and manipulation required for performance analysis, modeling and optimization of codes on existing and emerging architectures. In this paper we introduce an initial implementation of the third component, a system for visualizing roofline charts and managing roofline performance analysis data. We discuss the implementation and rationale for the integration of the roofline visualization system into the Eclipse IDE. An overview of our continuing efforts and goals in the development of this project is provided.
AI Key Findings
Get AI-generated insights about this paper's methodology, results, significance, and more — seven facets brought into focus.
Impact
Paper Details
PDF Preview
Key Terms
Citation Network
Current paper (gray), citations (green), references (blue)
Display is limited for performance on very large graphs.
Discussion 0