Publication
Metrics
AI Quick Summary
The paper introduces pyParaOcean, a scalable visualization system for ocean data analysis, featuring specialized modules for tasks like eddy identification. It leverages ParaView’s parallelization and Cinema database for efficient data handling, demonstrated through a case study on the Bay of Bengal.
Paper Preview
Abstract
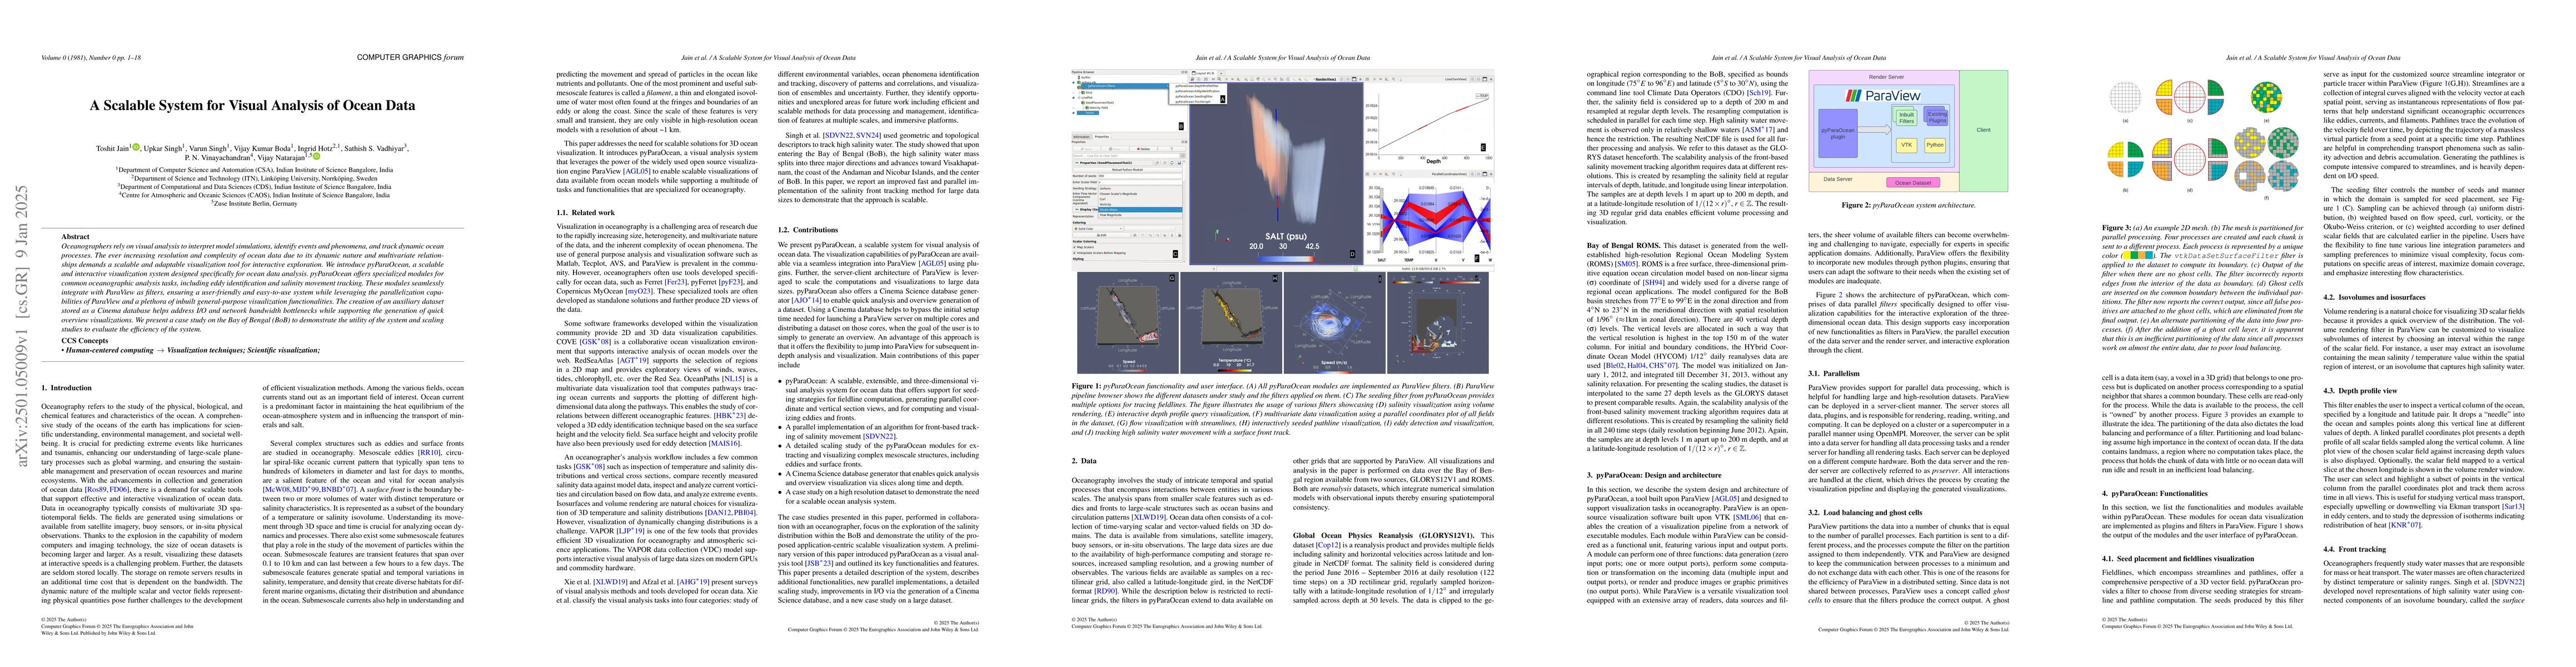
Oceanographers rely on visual analysis to interpret model simulations, identify events and phenomena, and track dynamic ocean processes. The ever increasing resolution and complexity of ocean data due to its dynamic nature and multivariate relationships demands a scalable and adaptable visualization tool for interactive exploration. We introduce pyParaOcean, a scalable and interactive visualization system designed specifically for ocean data analysis. pyParaOcean offers specialized modules for common oceanographic analysis tasks, including eddy identification and salinity movement tracking. These modules seamlessly integrate with ParaView as filters, ensuring a user-friendly and easy-to-use system while leveraging the parallelization capabilities of ParaView and a plethora of inbuilt general-purpose visualization functionalities. The creation of an auxiliary dataset stored as a Cinema database helps address I/O and network bandwidth bottlenecks while supporting the generation of quick overview visualizations. We present a case study on the Bay of Bengal (BoB) to demonstrate the utility of the system and scaling studies to evaluate the efficiency of the system.
AI Key Findings
Get AI-generated insights about this paper's methodology, results, significance, and more — seven facets brought into focus.
Paper Details
Authors
PDF Preview
Related Papers
No references found for this paper.
Discussion 0