Summary
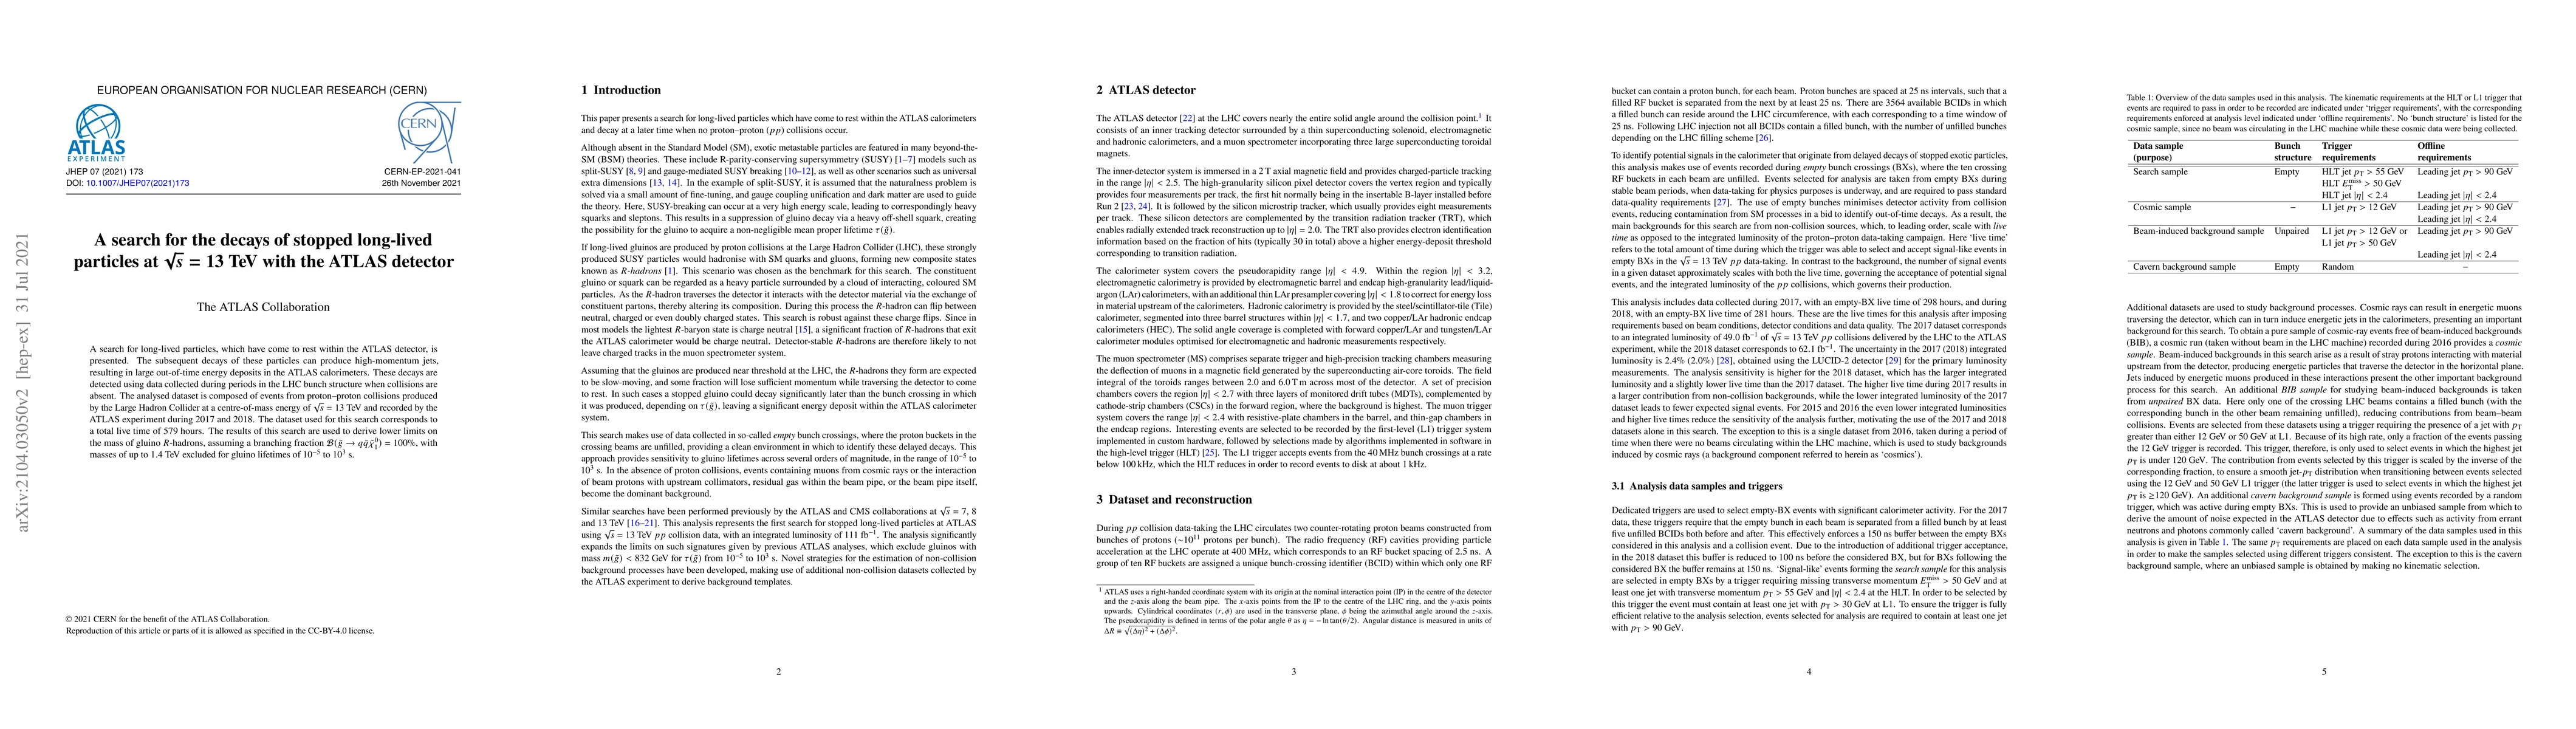
A search for long-lived particles, which have come to rest within the ATLAS detector, is presented. The subsequent decays of these long-lived particles can produce high-momentum jets, resulting in large out-of-time energy deposits in the ATLAS calorimeters. These decays are detected using data collected during periods in the LHC bunch structure when collisions are absent. The analysed dataset is composed of events from proton-proton collisions produced by the Large Hadron Collider at a centre-of-mass energy of $\sqrt{s}=13$ TeV and recorded by the ATLAS experiment during 2017 and 2018. The dataset used for this search corresponds to a total live time of 579 hours. The results of this search are used to derive lower limits on the mass of gluino $R$-hadrons, assuming a branching fraction $B(\tilde{g} \rightarrow q \bar{q} \tilde{\chi}_1^0)=100$%, with masses of up to 1.4 TeV excluded for gluino lifetimes of $10^{-5}$ to $10^3$ s.
AI Key Findings
Get AI-generated insights about this paper's methodology, results, and significance.
Paper Details
PDF Preview
Key Terms
Citation Network
Current paper (gray), citations (green), references (blue)
Display is limited for performance on very large graphs.
Similar Papers
Found 4 papersSearch for light long-lived particles in $pp$ collisions at $\sqrt{s}=13$ TeV using displaced vertices in the ATLAS inner detector
ATLAS Collaboration
No citations found for this paper.
Comments (0)