A Sentinel-2 multi-year, multi-country benchmark dataset for crop classification and segmentation with deep learning
Publication
Metrics
AI Quick Summary
This paper introduces Sen4AgriNet, a comprehensive Sentinel-2 based multi-country dataset for crop classification and segmentation using deep learning, annotated from farmer declarations. It includes a standardized crop taxonomy and covers 2016-2020 for Catalonia and France, featuring two sub-datasets for classification and segmentation tasks.
Paper Preview
Abstract
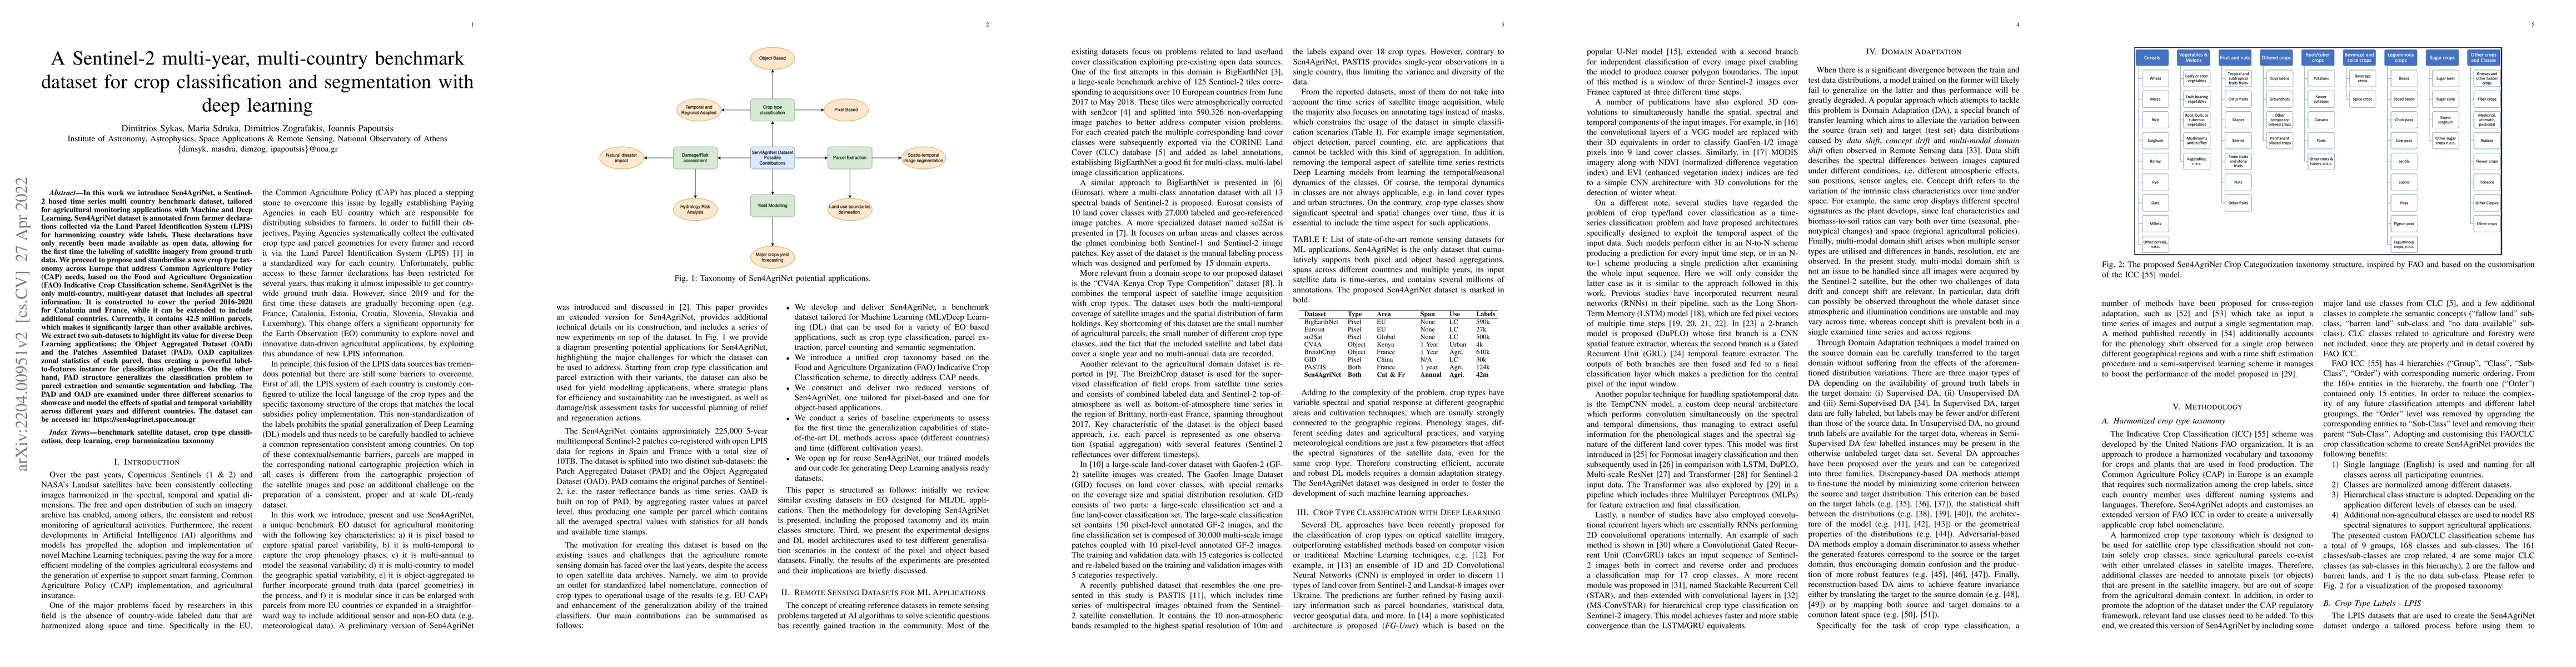
In this work we introduce Sen4AgriNet, a Sentinel-2 based time series multi country benchmark dataset, tailored for agricultural monitoring applications with Machine and Deep Learning. Sen4AgriNet dataset is annotated from farmer declarations collected via the Land Parcel Identification System (LPIS) for harmonizing country wide labels. These declarations have only recently been made available as open data, allowing for the first time the labeling of satellite imagery from ground truth data. We proceed to propose and standardise a new crop type taxonomy across Europe that address Common Agriculture Policy (CAP) needs, based on the Food and Agriculture Organization (FAO) Indicative Crop Classification scheme. Sen4AgriNet is the only multi-country, multi-year dataset that includes all spectral information. It is constructed to cover the period 2016-2020 for Catalonia and France, while it can be extended to include additional countries. Currently, it contains 42.5 million parcels, which makes it significantly larger than other available archives. We extract two sub-datasets to highlight its value for diverse Deep Learning applications; the Object Aggregated Dataset (OAD) and the Patches Assembled Dataset (PAD). OAD capitalizes zonal statistics of each parcel, thus creating a powerful label-to-features instance for classification algorithms. On the other hand, PAD structure generalizes the classification problem to parcel extraction and semantic segmentation and labeling. The PAD and OAD are examined under three different scenarios to showcase and model the effects of spatial and temporal variability across different years and different countries.
AI Key Findings
Get AI-generated insights about this paper's methodology, results, significance, and more — seven facets brought into focus.
Impact
Paper Details
Authors
PDF Preview
Key Terms
Citation Network
Current paper (gray), citations (green), references (blue)
Display is limited for performance on very large graphs.
Discussion 0