Publication
Metrics
Paper Preview
Abstract
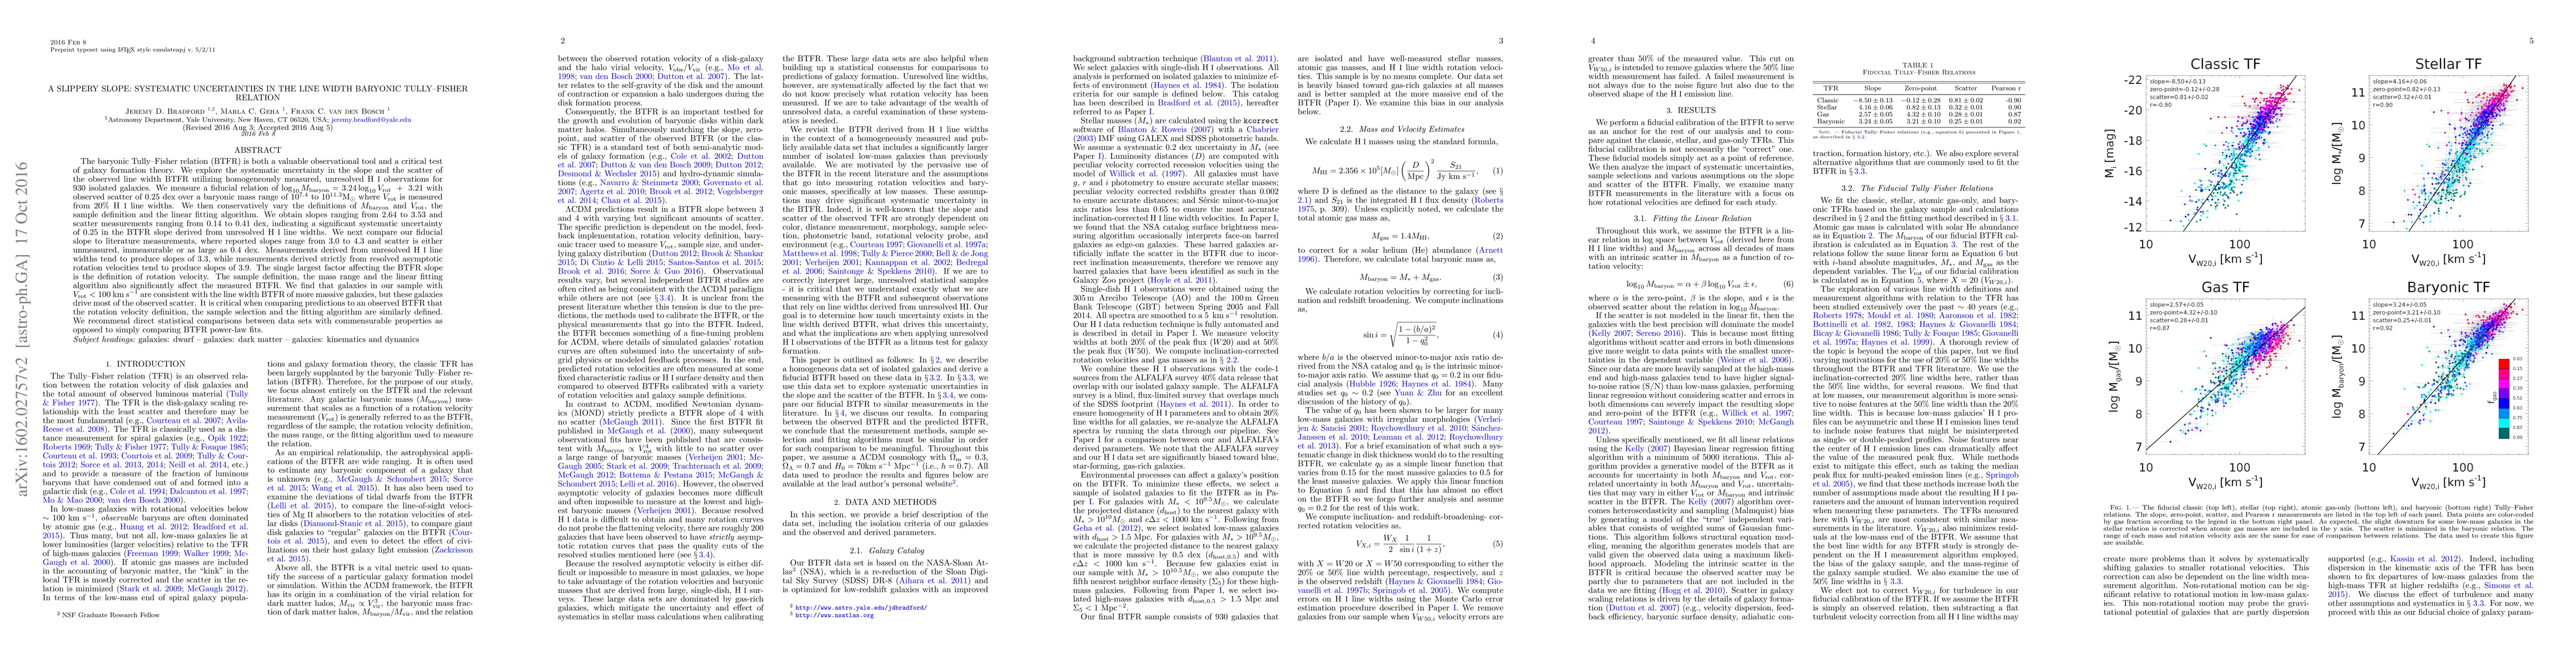
The baryonic Tully-Fisher relation (BTFR) is a valuable observational tool and a critical test of galaxy formation theory. We explore the systematic uncertainty in the slope and the scatter of the observed line width BTFR utilizing homogeneously measured, unresolved HI observations for 930 isolated galaxies. We measure a fiducial relation of $\log_{10}{M_{\rm baryon}} = 3.24\log_{10}{V_{\rm rot}}+3.21$ with observed scatter of 0.25 dex with $10^{7.4} < M_{\rm baryon} < 10^{11.3}M_{\odot}$ where $V_{\rm rot}$ is measured from 20\% HI line widths. We vary the definitions of $M_{\rm baryon}$ and $V_{\rm rot}$, the sample selection, and the linear fitting algorithm. We obtain slopes ranging from 2.64 to 3.53 and scatter measurements ranging from 0.14 to 0.41~dex, indicating a systematic uncertainty of 0.25 in the BTFR slope derived from unresolved HI line widths. We compare our fiducial slope to literature measurements, where reported slopes range from 3.0 to 4.3 and scatter is either unmeasured, immeasurable or as large as 0.4~dex. Measurements derived from unresolved HI line widths tend to produce slopes of 3.3, while measurements derived from asymptotic rotation curves tend to produce slopes of 3.9. The largest factor affecting the BTFR slope is the definition of $V_{\rm rot}$. The sample definition, the mass range, and the linear fitting algorithm also significantly affect the measured BTFR. We find that galaxies in our sample with $V_{\rm rot} < 100~\rm{km~s^{-1}}$ are consistent with the line width BTFR of more massive galaxies, but these galaxies drive most of the observed scatter. It is critical when comparing predictions to an observed BTFR that the $V_{\rm rot}$ definition, the sample selection and the fitting algorithm are similarly defined. We recommend direct statistical comparisons between data sets with commensurable properties as opposed to comparing BTFR power-law fits.
AI Key Findings
Get AI-generated insights about this paper's methodology, results, significance, and more — seven facets brought into focus.
Impact
Paper Details
PDF Preview
Key Terms
Citation Network
Current paper (gray), citations (green), references (blue)
Display is limited for performance on very large graphs.
Discussion 0