Publication
Metrics
AI Quick Summary
This paper uses spectral analysis to estimate and predict stock market performance for the US, Japan, and Germany. By applying harmonic analysis on deflated and trend-removed data, it identifies hidden periodicities that approximate stock value movements, successfully predicting the fall in stock market values from July 2008 onwards.
Paper Preview
Abstract
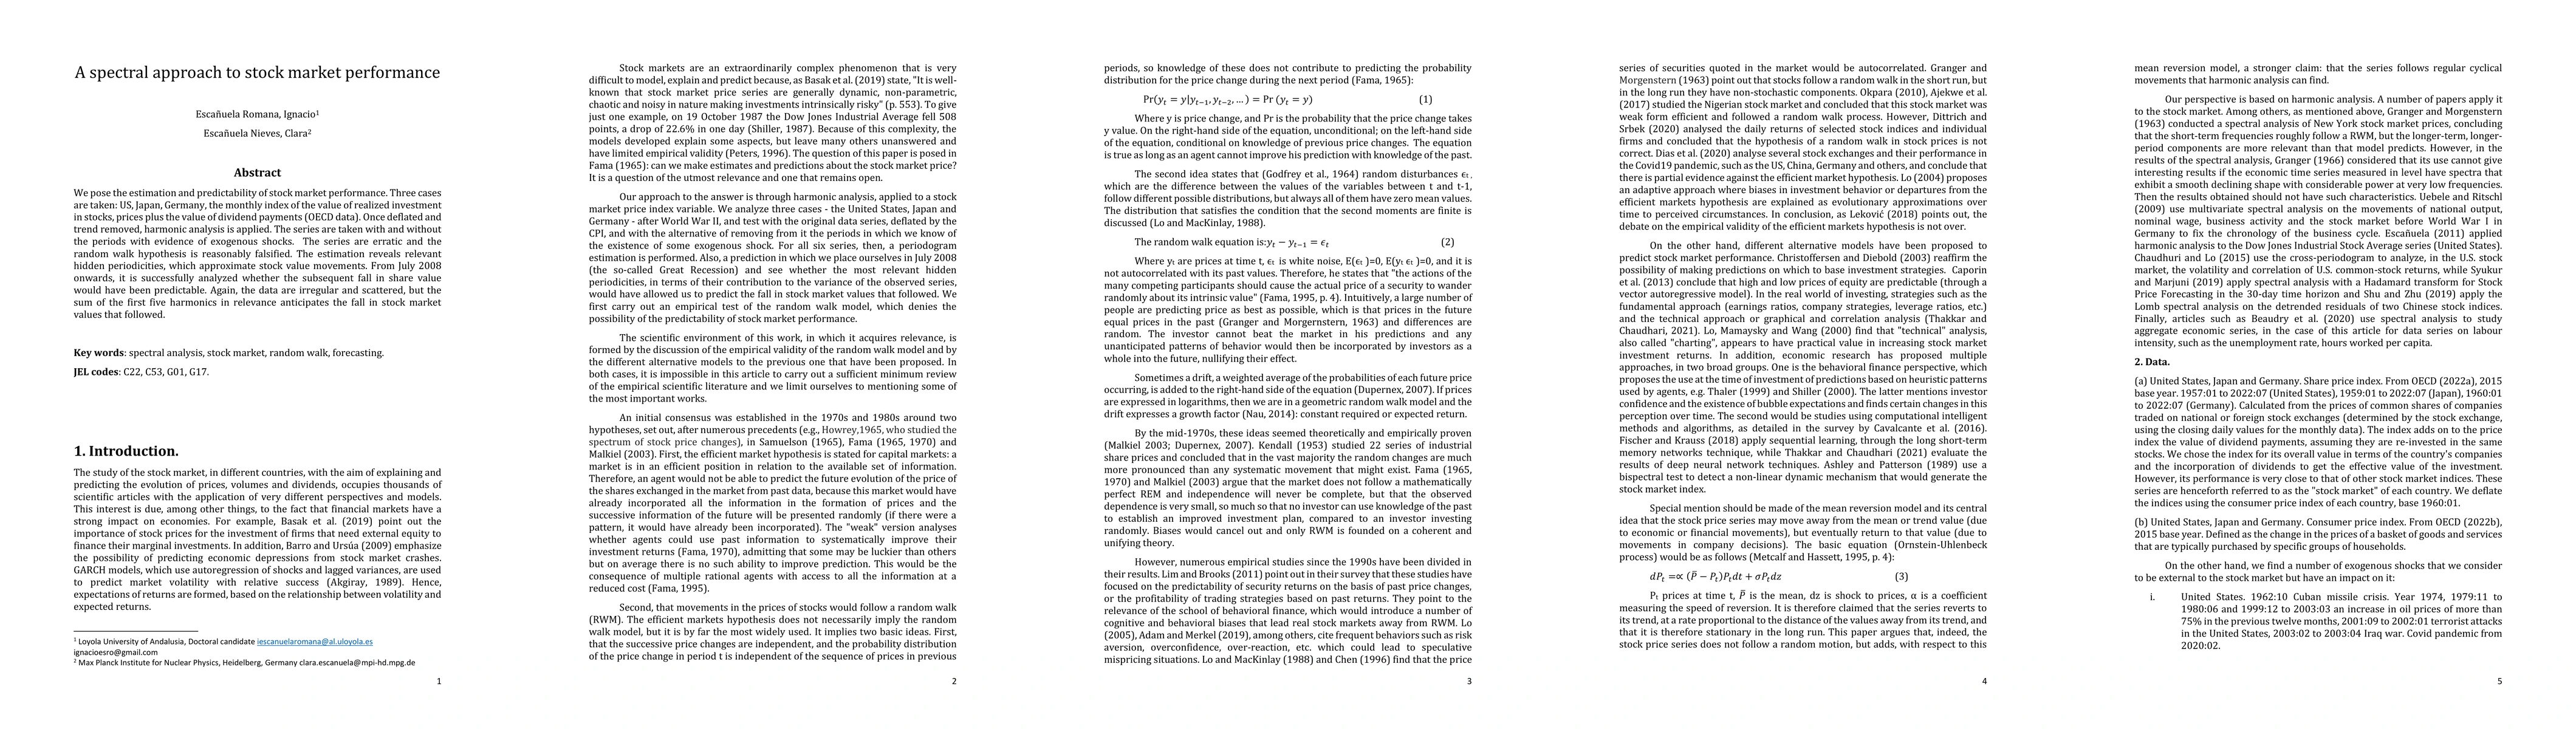
We pose the estimation and predictability of stock market performance. Three cases are taken: US, Japan, Germany, the monthly index of the value of realized investment in stocks, prices plus the value of dividend payments (OECD data). Once deflated and trend removed, harmonic analysis is applied. The series are taken with and without the periods with evidence of exogenous shocks. The series are erratic and the random walk hypothesis is reasonably falsified. The estimation reveals relevant hidden periodicities, which approximate stock value movements. From July 2008 onwards, it is successfully analyzed whether the subsequent fall in share value would have been predictable. Again, the data are irregular and scattered, but the sum of the first five harmonics in relevance anticipates the fall in stock market values that followed.
AI Key Findings
Get AI-generated insights about this paper's methodology, results, significance, and more — seven facets brought into focus.
Impact
Paper Details
Authors
PDF Preview
Key Terms
Citation Network
Current paper (gray), citations (green), references (blue)
Display is limited for performance on very large graphs.
Discussion 0