01
MethodologyHow they did it
The research used a combination of spectroscopic and photometric data to create a comprehensive catalog of galaxy clusters.
The research used a combination of spectroscopic and photometric data to create a comprehensive catalog of galaxy clusters. More in Methodology →
The catalog contains 1000 galaxy clusters with accurate redshift measurements. — The cluster distribution shows a clear bias towards the equatorial region. More in Key Results →
This research contributes to our understanding of galaxy cluster evolution and the distribution of matter in the universe. More in Significance →
The sample size is limited by the availability of high-quality spectroscopic data. — The catalog may not be representative of the entire universe due to selection biases. More in Limitations →
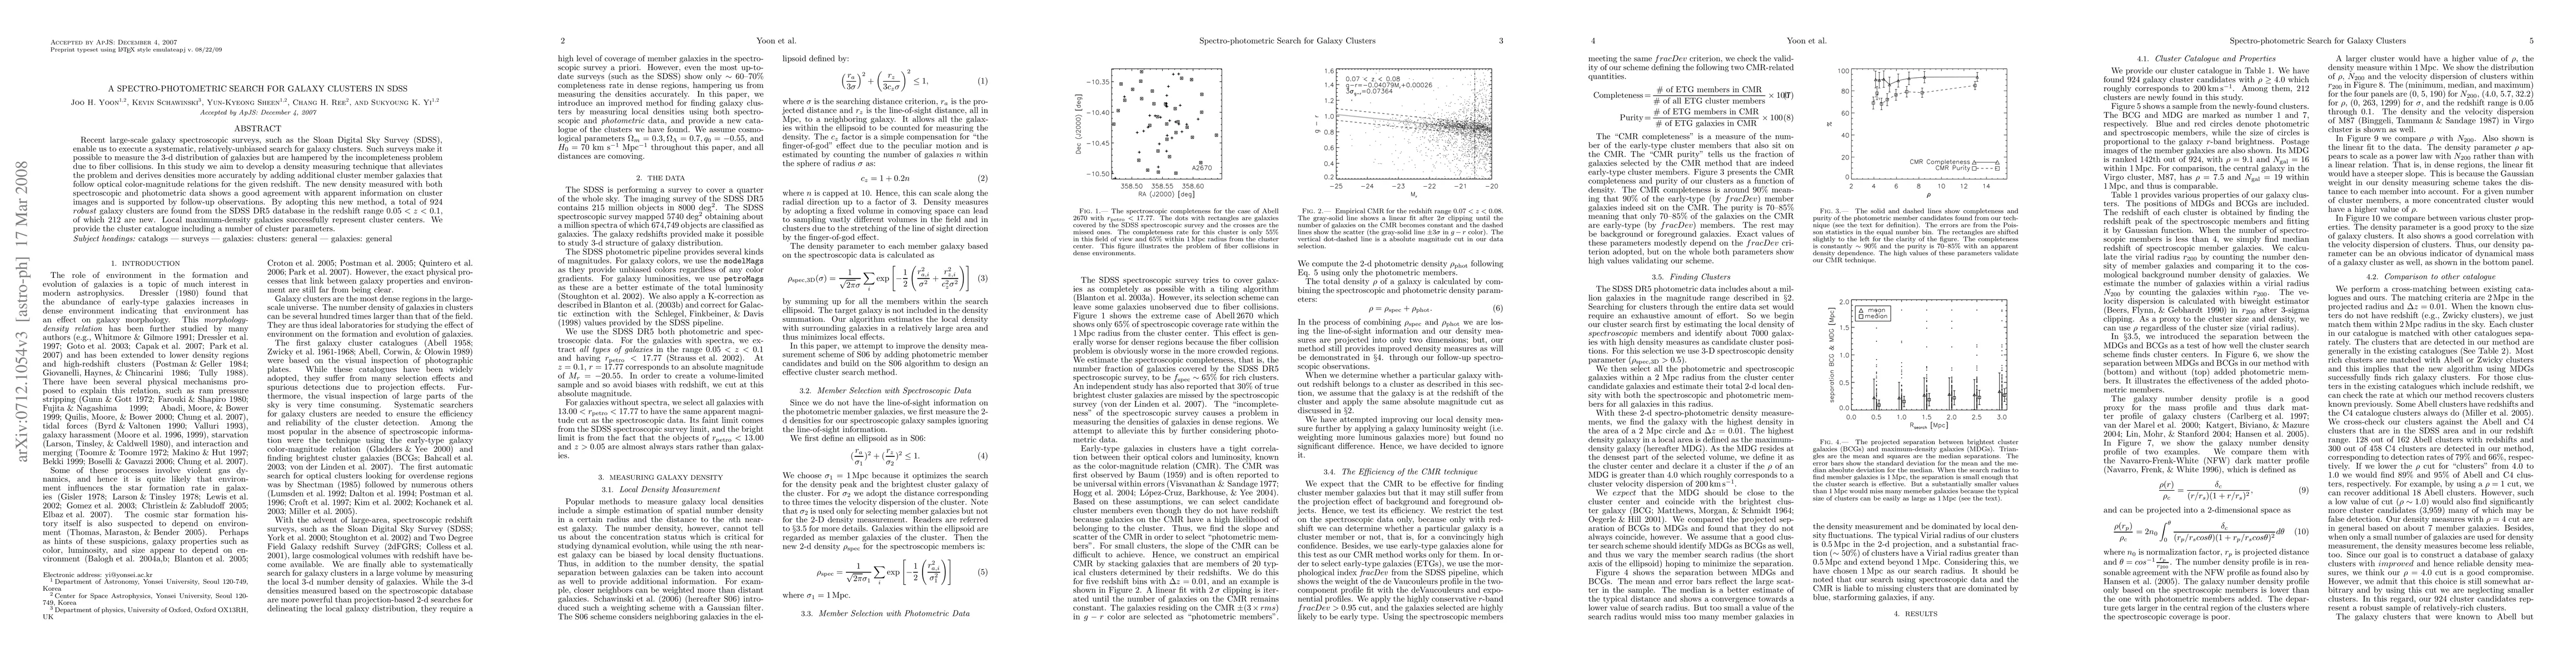
Recent large-scale galaxy spectroscopic surveys, such as the Sloan Digital Sky Survey (SDSS), enable us to execute a systematic, relatively-unbiased search for galaxy clusters. Such surveys make it possible to measure the 3-d distribution of galaxies but are hampered by the incompleteness problem due to fiber collisions. In this study we aim to develop a density measuring technique that alleviates the problem and derives densities more accurately by adding additional cluster member galaxies that follow optical color-magnitude relations for the given redshift. The new density measured with both spectroscopic and photometric data shows a good agreement with apparent information on cluster images and is supported by follow-up observations. By adopting this new method, a total of 924 $robust$ galaxy clusters are found from the SDSS DR5 database in the redshift range $0.05
Seven facets of this paper, analysed and brought into focus by AI.
This research contributes to our understanding of galaxy cluster evolution and the distribution of matter in the universe.
The research used a combination of spectroscopic and photometric data to create a comprehensive catalog of galaxy clusters.
This research contributes to our understanding of galaxy cluster evolution and the distribution of matter in the universe.
The development of a new algorithm for accurately measuring redshifts from spectroscopic data.
This research presents a novel approach to combining spectroscopic and photometric data for galaxy cluster catalog creation.
Current paper (gray), citations (green), references (blue)
Display is limited for performance on very large graphs.
Discussion 0