Summary
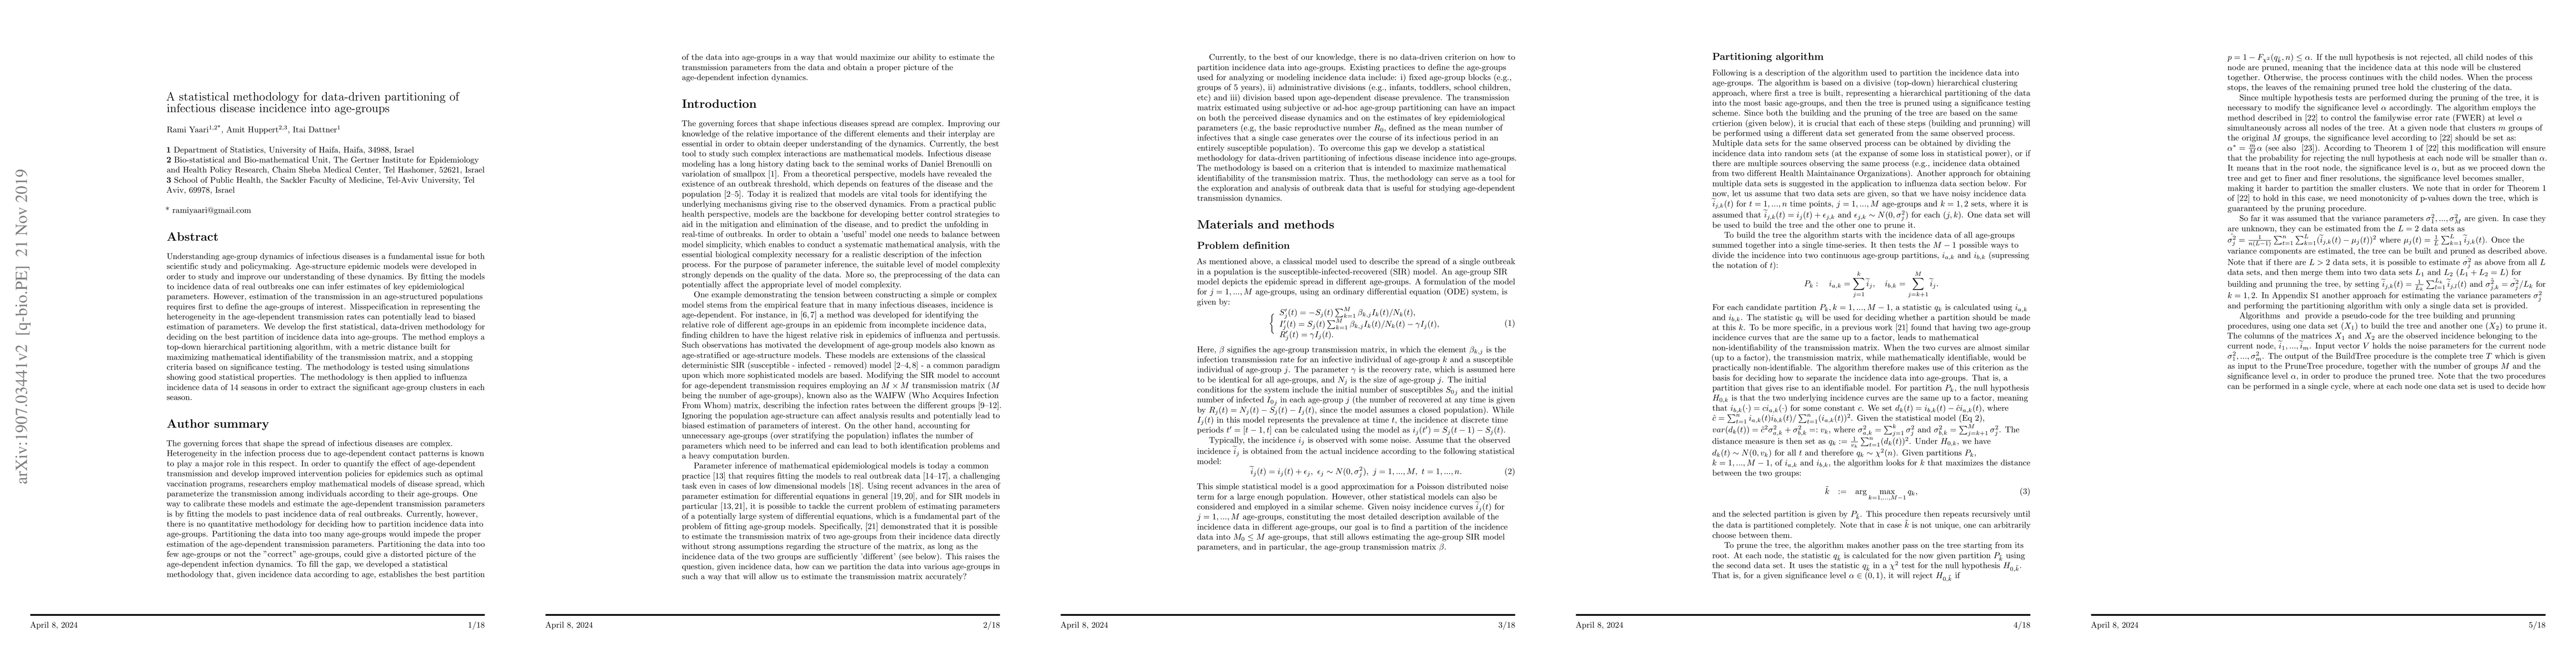
Understanding age-group dynamics of infectious diseases is a fundamental issue for both scientific study and policymaking. Age-structure epidemic models were developed in order to study and improve our understanding of these dynamics. By fitting the models to incidence data of real outbreaks one can infer estimates of key epidemiological parameters. However, estimation of the transmission in an age-structured populations requires first to define the age-groups of interest. Misspecification in representing the heterogeneity in the age-dependent transmission rates can potentially lead to biased estimation of parameters. We develop the first statistical, data-driven methodology for deciding on the best partition of incidence data into age-groups. The method employs a top-down hierarchical partitioning algorithm, with a metric distance built for maximizing mathematical identifiability of the transmission matrix, and a stopping criteria based on significance testing. The methodology is tested using simulations showing good statistical properties. The methodology is then applied to influenza incidence data of 14 seasons in order to extract the significant age-group clusters in each season.
AI Key Findings
Get AI-generated insights about this paper's methodology, results, and significance.
Paper Details
PDF Preview
Key Terms
Citation Network
Current paper (gray), citations (green), references (blue)
Display is limited for performance on very large graphs.
Similar Papers
Found 4 papers| Title | Authors | Year | Actions |
|---|
Comments (0)