A statistical model of tristimulus measurements within and between OLED displays
Publication
Metrics
AI Quick Summary
Summary: This paper introduces a simple empirical model to describe the anisotropic noise in tristimulus measurements from OLED displays, showing that noise is greatest along a vector from the origin to the measured XYZ value. Tests reveal that variations between different OLED panels exhibit similar noise distribution as the temporal noise within a single panel but with greater magnitude.
Paper Preview
Abstract
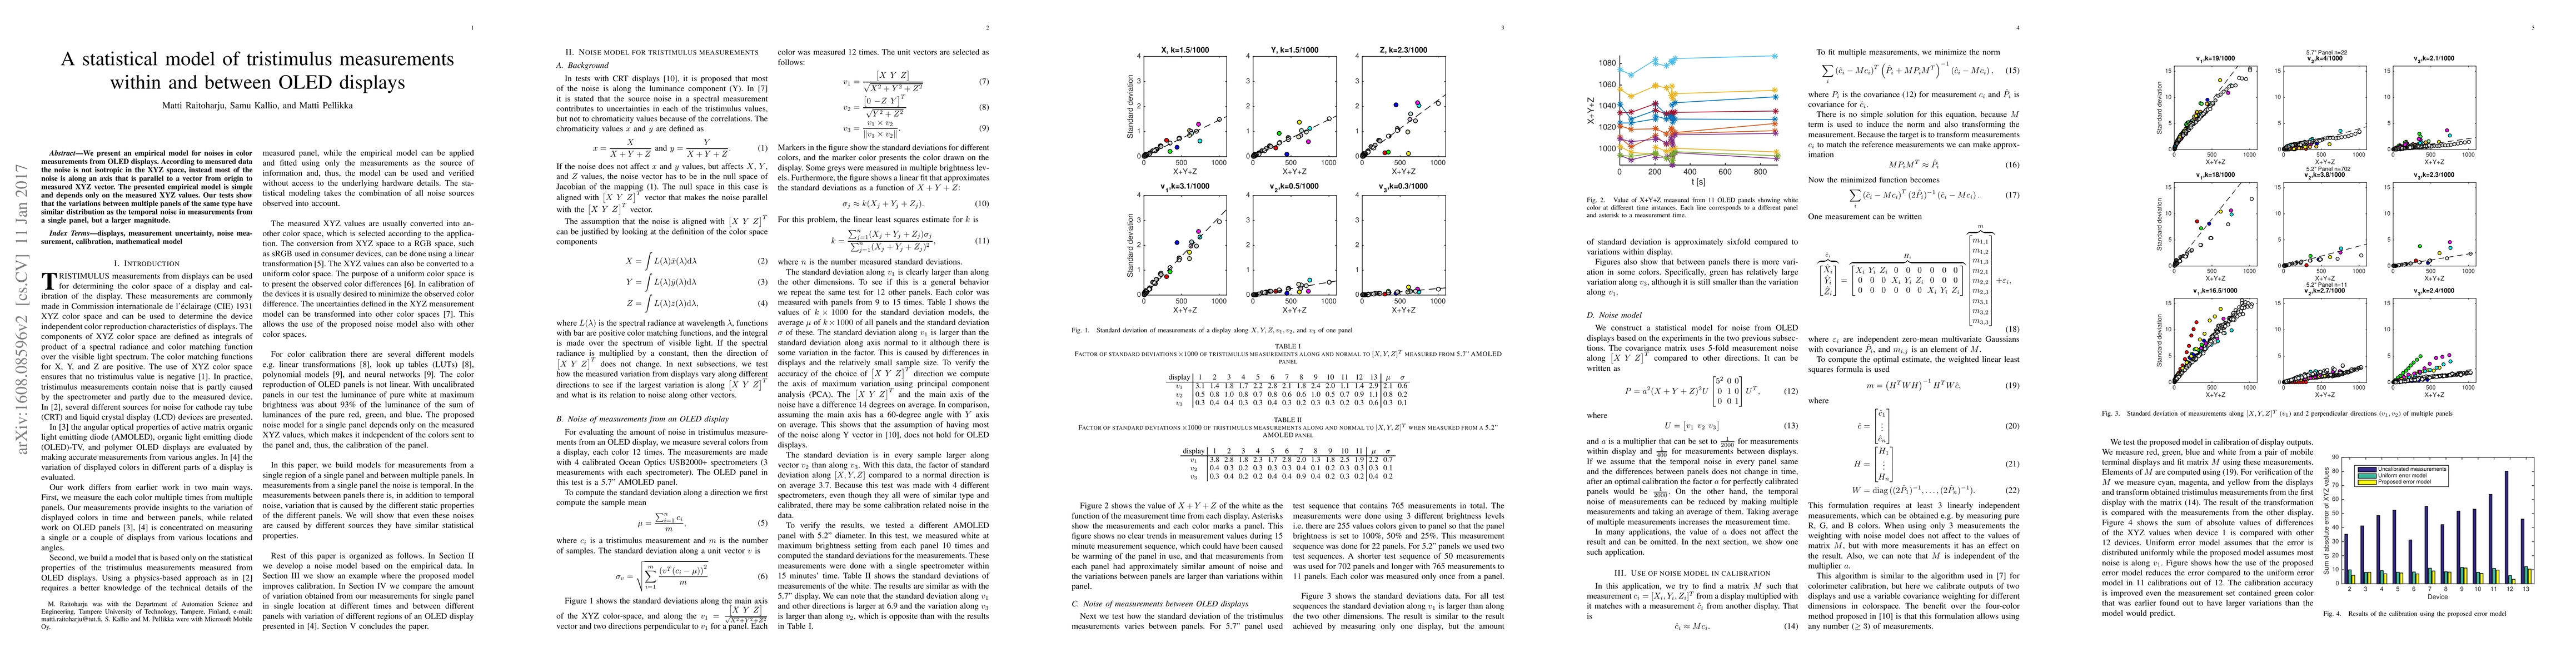
We present an empirical model for noises in color measurements from OLED displays. According to measured data the noise is not isotropic in the XYZ space, instead most of the noise is along an axis that is parallel to a vector from origin to measured XYZ vector. The presented empirical model is simple and depends only on the measured XYZ values. Our tests show that the variations between multiple panels of the same type have similar distribution as the temporal noise in measurements from a single panel, but a larger magnitude.
AI Key Findings
Get AI-generated insights about this paper's methodology, results, significance, and more — seven facets brought into focus.
Impact
Paper Details
PDF Preview
Key Terms
Citation Network
Current paper (gray), citations (green), references (blue)
Display is limited for performance on very large graphs.
Discussion 0