Summary
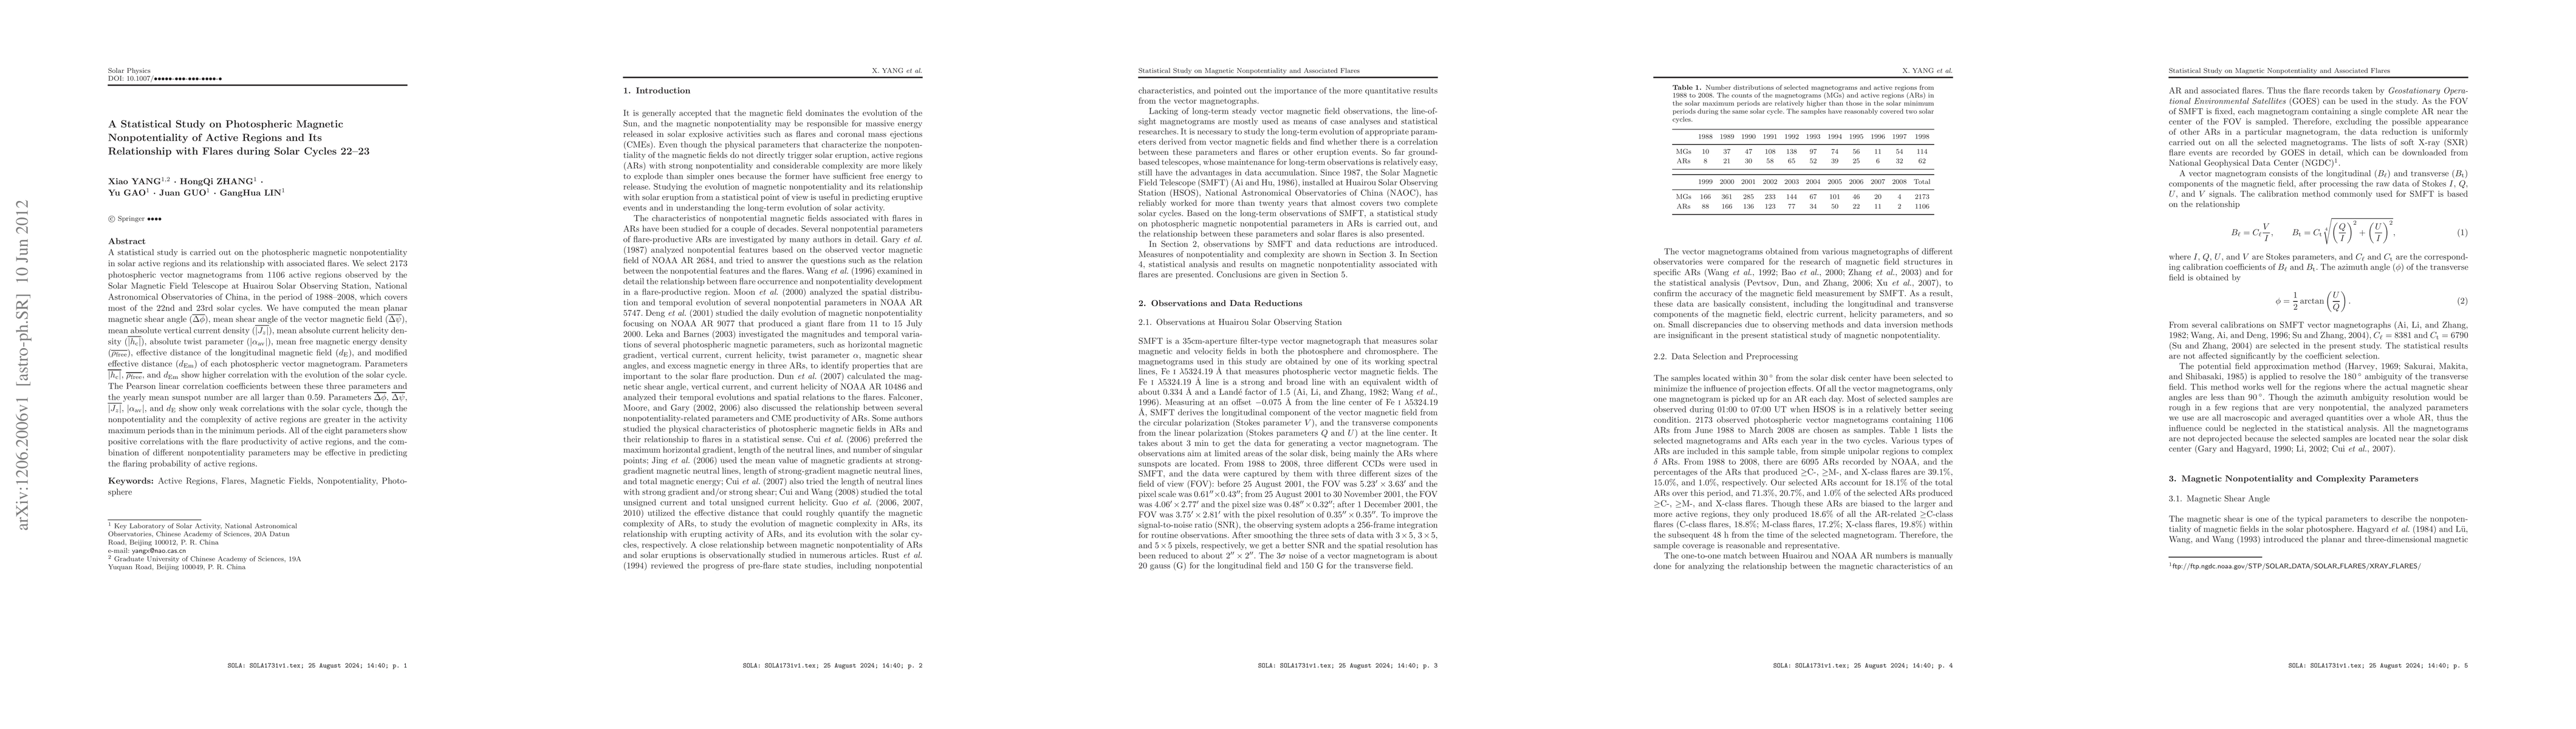
A statistical study is carried out on the photospheric magnetic nonpotentiality in solar active regions and its relationship with associated flares. We select 2173 photospheric vector magnetograms from 1106 active regions observed by the Solar Magnetic Field Telescope at Huairou Solar Observing Station, National Astronomical Observatories of China, in the period of 1988-2008, which covers most of the 22nd and 23rd solar cycles. We have computed the mean planar magnetic shear angle (\bar{\Delta\phi}), mean shear angle of the vector magnetic field (\bar{\Delta\psi}), mean absolute vertical current density (\bar{|J_{z}|}), mean absolute current helicity density (\bar{|h_{c}|}), absolute twist parameter (|\alpha_{av}|), mean free magnetic energy density (\bar{\rho_{free}}), effective distance of the longitudinal magnetic field (d_{E}), and modified effective distance (d_{Em}) of each photospheric vector magnetogram. Parameters \bar{|h_{c}|}, \bar{\rho_{free}}, and d_{Em} show higher correlation with the evolution of the solar cycle. The Pearson linear correlation coefficients between these three parameters and the yearly mean sunspot number are all larger than 0.59. Parameters \bar{\Delta\phi}, \bar{\Delta\psi}, \bar{|J_{z}|}, |\alpha_{av}|, and d_{E} show only weak correlations with the solar cycle, though the nonpotentiality and the complexity of active regions are greater in the activity maximum periods than in the minimum periods. All of the eight parameters show positive correlations with the flare productivity of active regions, and the combination of different nonpotentiality parameters may be effective in predicting the flaring probability of active regions.
AI Key Findings
Get AI-generated insights about this paper's methodology, results, and significance.
Paper Details
PDF Preview
Key Terms
Citation Network
Current paper (gray), citations (green), references (blue)
Display is limited for performance on very large graphs.
Similar Papers
Found 4 papersStudy of Solar Energetic Particles: their Source Regions, Flares and CMEs during Solar Cycles 23-24
Ramesh Chandra, Raj Kumar, Bimal Pande et al.
| Title | Authors | Year | Actions |
|---|
Comments (0)