Publication
Published:
Aug 12, 2025
Categories:
q-bio.QM, 05C90
Metrics
Source:
ArXiv
Paper Preview
Abstract
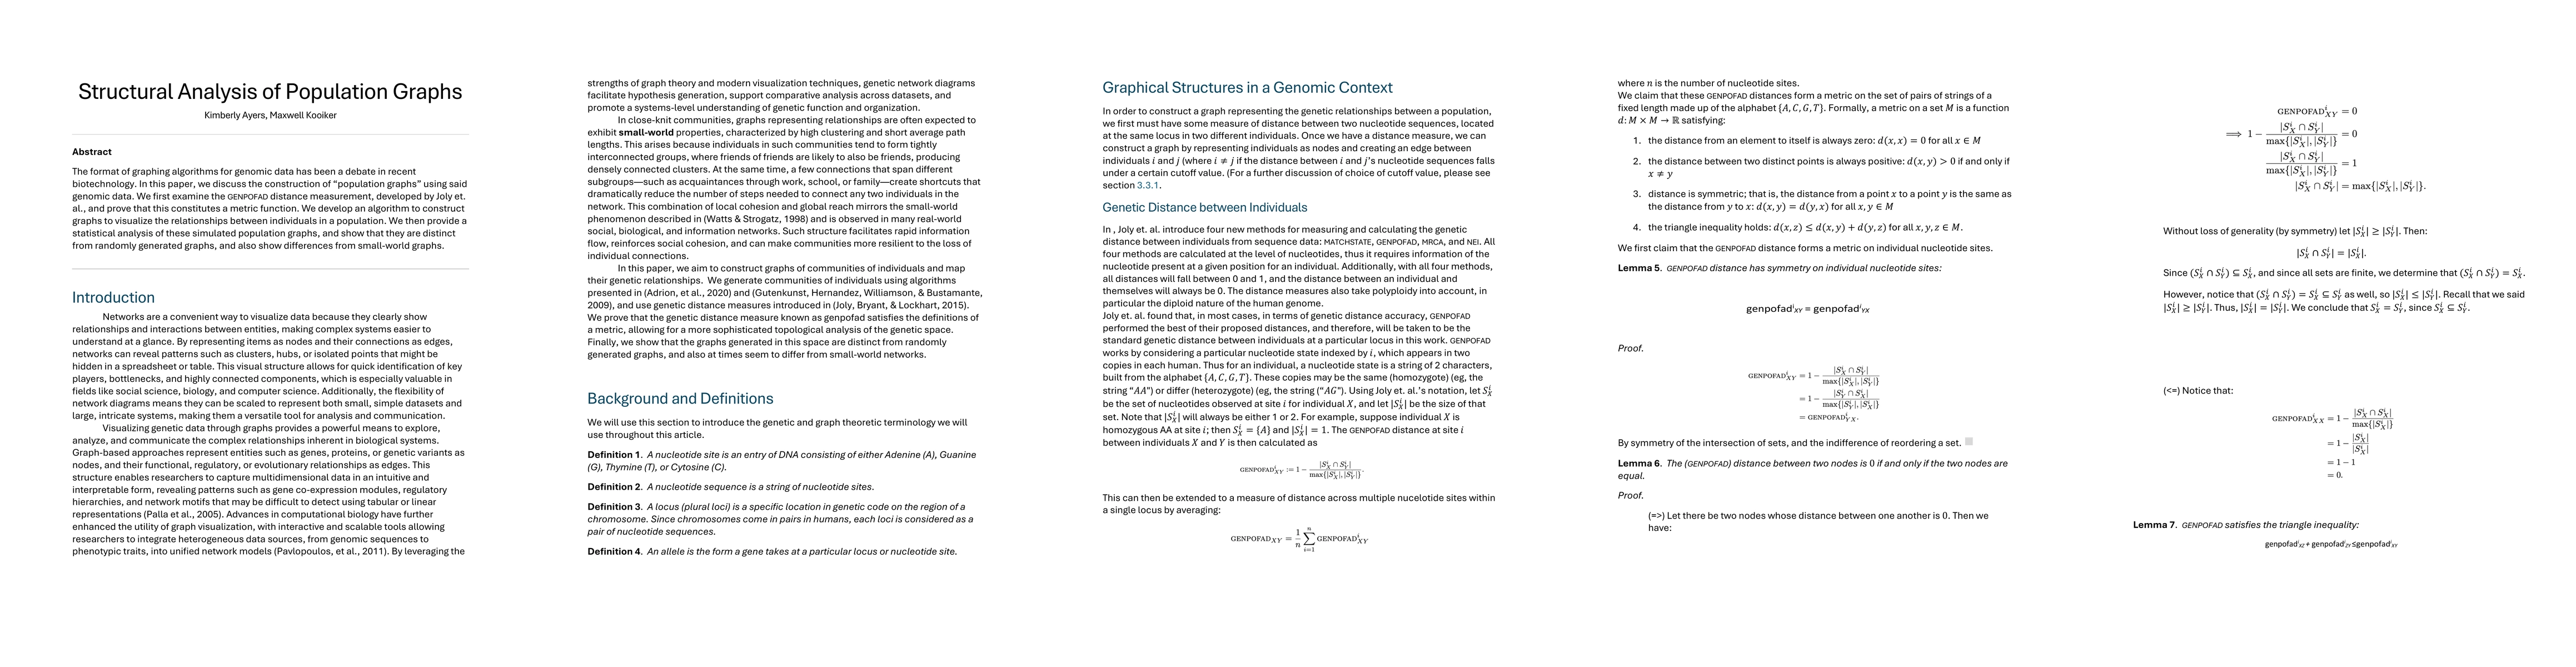
The format of graphing algorithms for genomic data has been a debate in recent biotechnology. In this paper, we discuss the construction of population graphs using said genomic data. We first examine the GENPOFAD distance measurement, developed by Joly et. al., and prove that this constitutes a metric function. We develop an algorithm to construct graphs to visualize the relationships between individuals in a population. We then provide a statistical analysis of these simulated population graphs, and show that they are distinct from randomly generated graphs, and also show differences from small-world graphs.
AI Key Findings
Get AI-generated insights about this paper's methodology, results, significance, and more — seven facets brought into focus.
Discussion 0