A student experiment on error analysis and uncertainties based on mobile--device sensors
Publication
Metrics
Paper Preview
Abstract
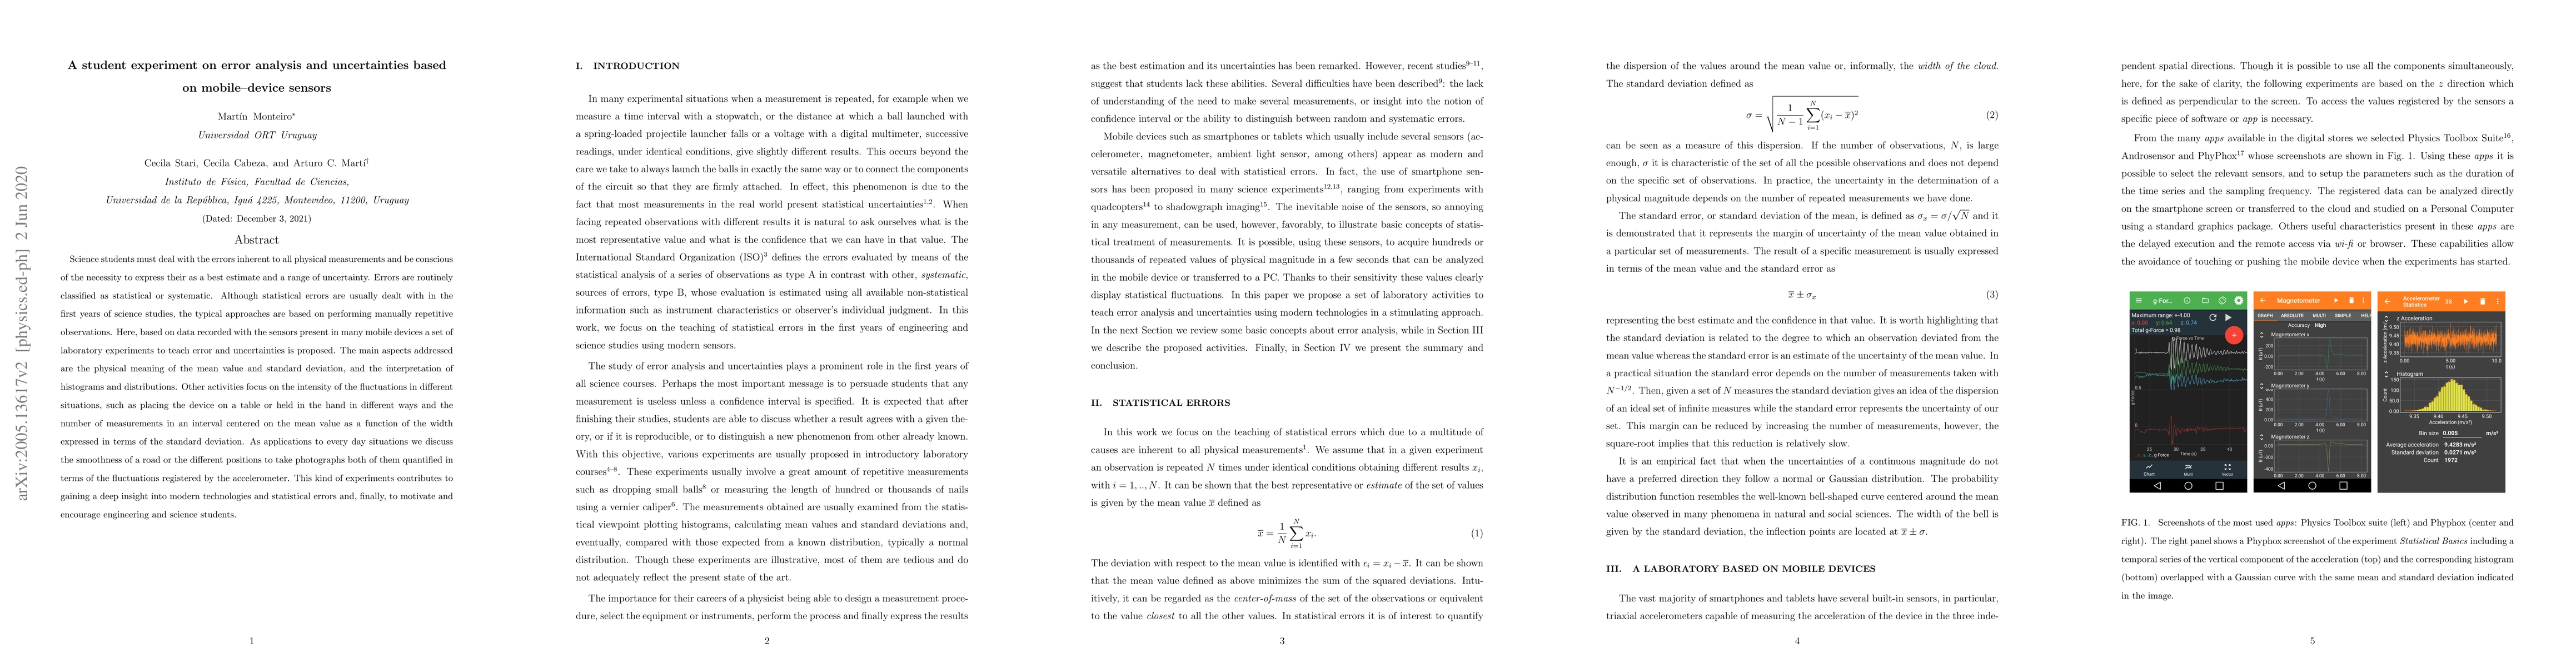
Science students must deal with the errors inherent to all physical measurements and be conscious of the necessity to express their as a best estimate and a range of uncertainty. Errors are routinely classified as statistical or systematic. Although statistical errors are usually dealt with in the first years of science studies, the typical approaches are based on performing manually repetitive observations. Here, based on data recorded with the sensors present in many mobile devices a set of laboratory experiments to teach error and uncertainties is proposed. The main aspects addressed are the physical meaning of the mean value and standard deviation, and the interpretation of histograms and distributions. Other activities focus on the intensity of the fluctuations in different situations, such as placing the device on a table or held in the hand in different ways and the number of measurements in an interval centered on the mean value as a function of the width expressed in terms of the standard deviation. As applications to every day situations we discuss the smoothness of a road or the different positions to take photographs both of them quantified in terms of the fluctuations registered by the accelerometer. This kind of experiments contributes to gaining a deep insight into modern technologies and statistical errors and, finally, to motivate and encourage engineering and science students.
AI Key Findings
Get AI-generated insights about this paper's methodology, results, significance, and more — seven facets brought into focus.
Impact
Paper Details
PDF Preview
Key Terms
Citation Network
Current paper (gray), citations (green), references (blue)
Display is limited for performance on very large graphs.
Discussion 0