A Survey of Designs for Combined 2D+3D Visual Representations
Publication
Metrics
AI Quick Summary
This paper surveys the methods used to combine 2D and 3D visual representations in major visualization publications from 2012 to 2022, analyzing 105 papers. It introduces a design space and provides guidelines for effectively linking these representations based on visual environments, relationships, and layouts.
Paper Preview
Abstract
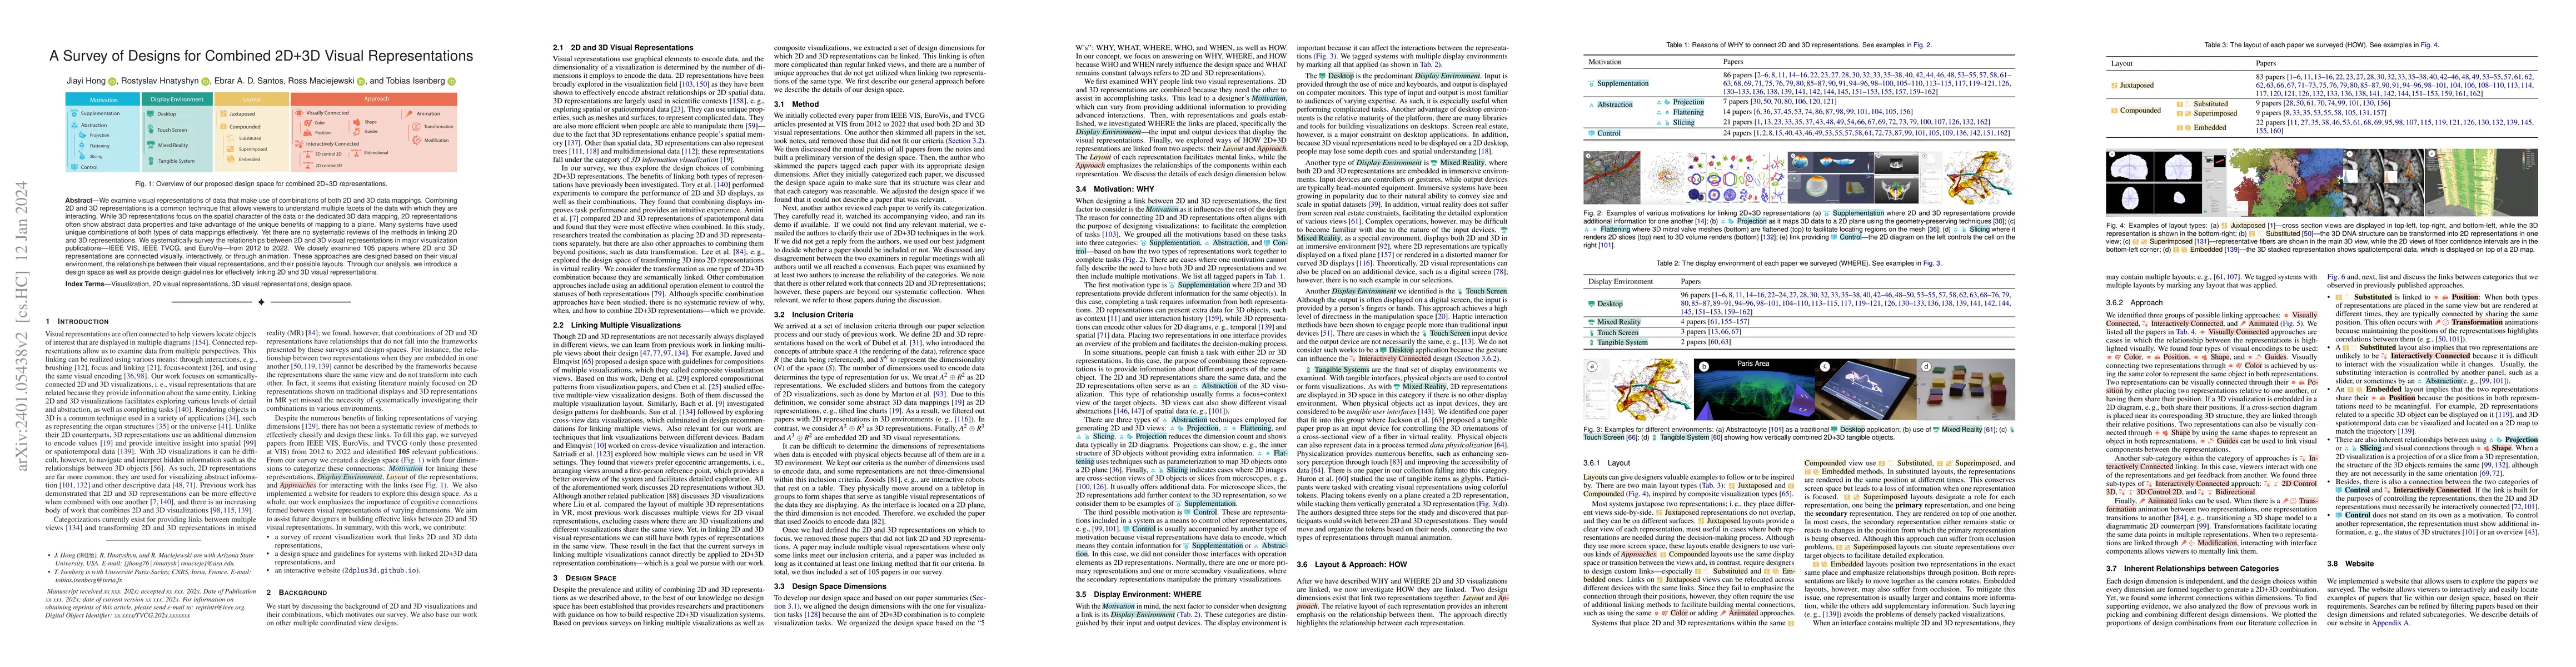
We examine visual representations of data that make use of combinations of both 2D and 3D data mappings. Combining 2D and 3D representations is a common technique that allows viewers to understand multiple facets of the data with which they are interacting. While 3D representations focus on the spatial character of the data or the dedicated 3D data mapping, 2D representations often show abstract data properties and take advantage of the unique benefits of mapping to a plane. Many systems have used unique combinations of both types of data mappings effectively. Yet there are no systematic reviews of the methods in linking 2D and 3D representations. We systematically survey the relationships between 2D and 3D visual representations in major visualization publications -- IEEE VIS, IEEE TVCG, and EuroVis -- from 2012 to 2022. We closely examined 105 papers where 2D and 3D representations are connected visually, interactively, or through animation. These approaches are designed based on their visual environment, the relationships between their visual representations, and their possible layouts. Through our analysis, we introduce a design space as well as provide design guidelines for effectively linking 2D and 3D visual representations.
AI Key Findings
Get AI-generated insights about this paper's methodology, results, significance, and more — seven facets brought into focus.
Impact
Paper Details
Authors
PDF Preview
Key Terms
Citation Network
Current paper (gray), citations (green), references (blue)
Display is limited for performance on very large graphs.
Discussion 0