A Survey of Visual Analytics Techniques for Machine Learning
Publication
Metrics
AI Quick Summary
This paper systematically reviews visual analytics techniques for machine learning, categorizing them into three main phases: pre-model, during-model, and post-model building. It highlights research challenges and future opportunities, providing a taxonomy of techniques and influential works.
Paper Preview
Abstract
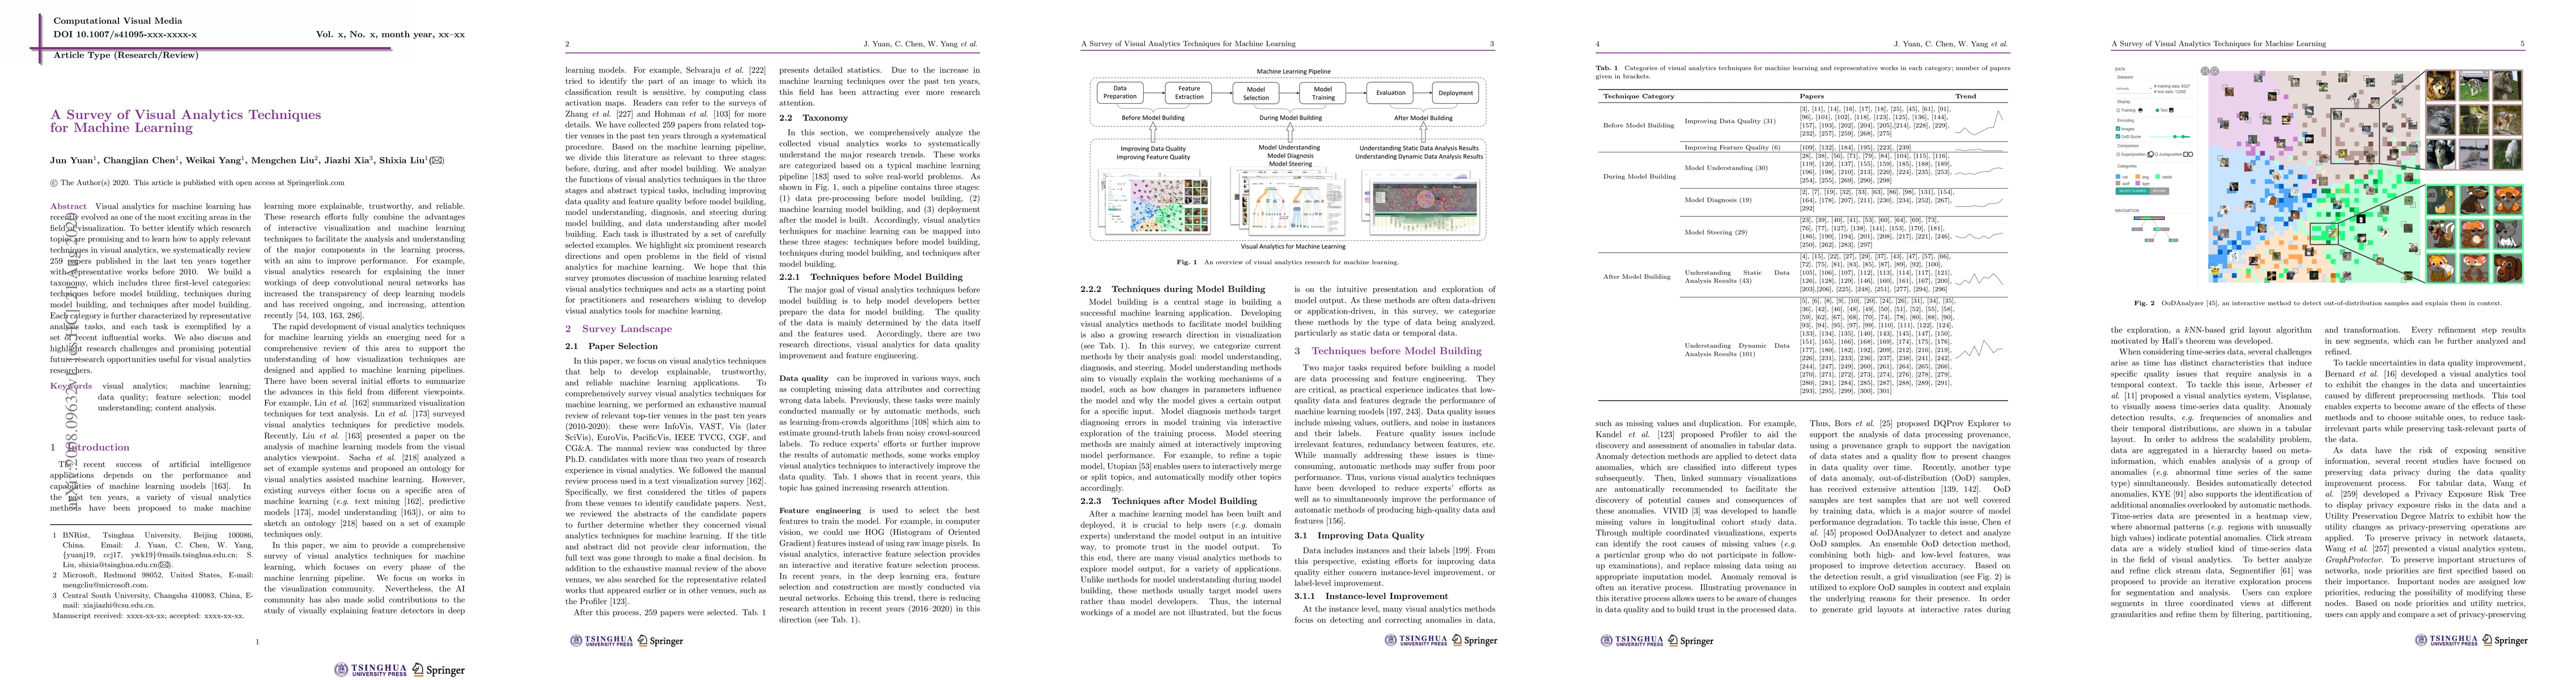
Visual analytics for machine learning has recently evolved as one of the most exciting areas in the field of visualization. To better identify which research topics are promising and to learn how to apply relevant techniques in visual analytics, we systematically review 259 papers published in the last ten years together with representative works before 2010. We build a taxonomy, which includes three first-level categories: techniques before model building, techniques during model building, and techniques after model building. Each category is further characterized by representative analysis tasks, and each task is exemplified by a set of recent influential works. We also discuss and highlight research challenges and promising potential future research opportunities useful for visual analytics researchers.
AI Key Findings
Get AI-generated insights about this paper's methodology, results, significance, and more — seven facets brought into focus.
Impact
Paper Details
Authors
PDF Preview
Key Terms
Citation Network
Current paper (gray), citations (green), references (blue)
Display is limited for performance on very large graphs.
Discussion 0