A Survey on Temporal Interaction Graph Representation Learning: Progress, Challenges, and Opportunities
Publication
Metrics
AI Quick Summary
This paper surveys temporal interaction graph representation learning (TIGRL), categorizing state-of-the-art methods based on their use of structural and temporal information. It also highlights key challenges and opportunities, along with curated datasets and benchmarks to support future research.
Paper Preview
Abstract
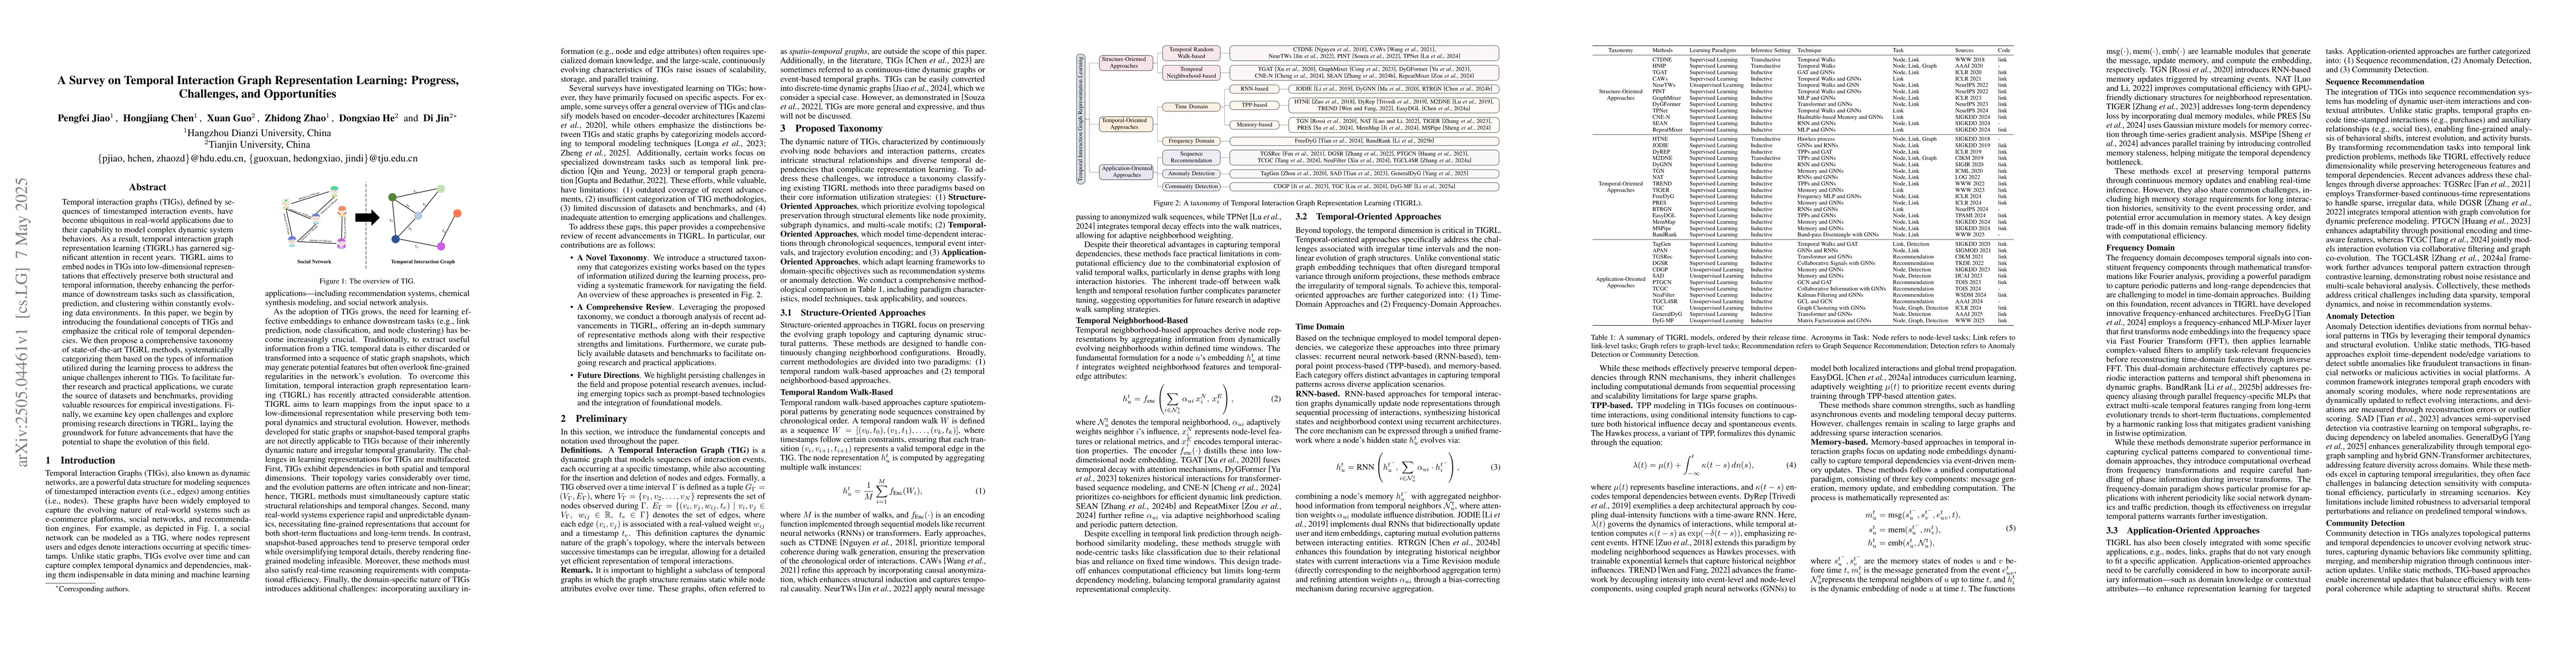
Temporal interaction graphs (TIGs), defined by sequences of timestamped interaction events, have become ubiquitous in real-world applications due to their capability to model complex dynamic system behaviors. As a result, temporal interaction graph representation learning (TIGRL) has garnered significant attention in recent years. TIGRL aims to embed nodes in TIGs into low-dimensional representations that effectively preserve both structural and temporal information, thereby enhancing the performance of downstream tasks such as classification, prediction, and clustering within constantly evolving data environments. In this paper, we begin by introducing the foundational concepts of TIGs and emphasize the critical role of temporal dependencies. We then propose a comprehensive taxonomy of state-of-the-art TIGRL methods, systematically categorizing them based on the types of information utilized during the learning process to address the unique challenges inherent to TIGs. To facilitate further research and practical applications, we curate the source of datasets and benchmarks, providing valuable resources for empirical investigations. Finally, we examine key open challenges and explore promising research directions in TIGRL, laying the groundwork for future advancements that have the potential to shape the evolution of this field.
AI Key Findings
Get AI-generated insights about this paper's methodology, results, significance, and more — seven facets brought into focus.
Impact
Paper Details
Authors
PDF Preview
Citation Network
Current paper (gray), citations (green), references (blue)
Display is limited for performance on very large graphs.
Discussion 0