Publication
Metrics
AI Quick Summary
This paper systematically reviews modern software visualization techniques, analyzing 105 relevant papers published between 2013-2019 to classify and characterize various visualizations based on software engineering tasks and user roles. It provides an overview of current trends and identifies research opportunities and practical tools for developers.
Paper Preview
Abstract
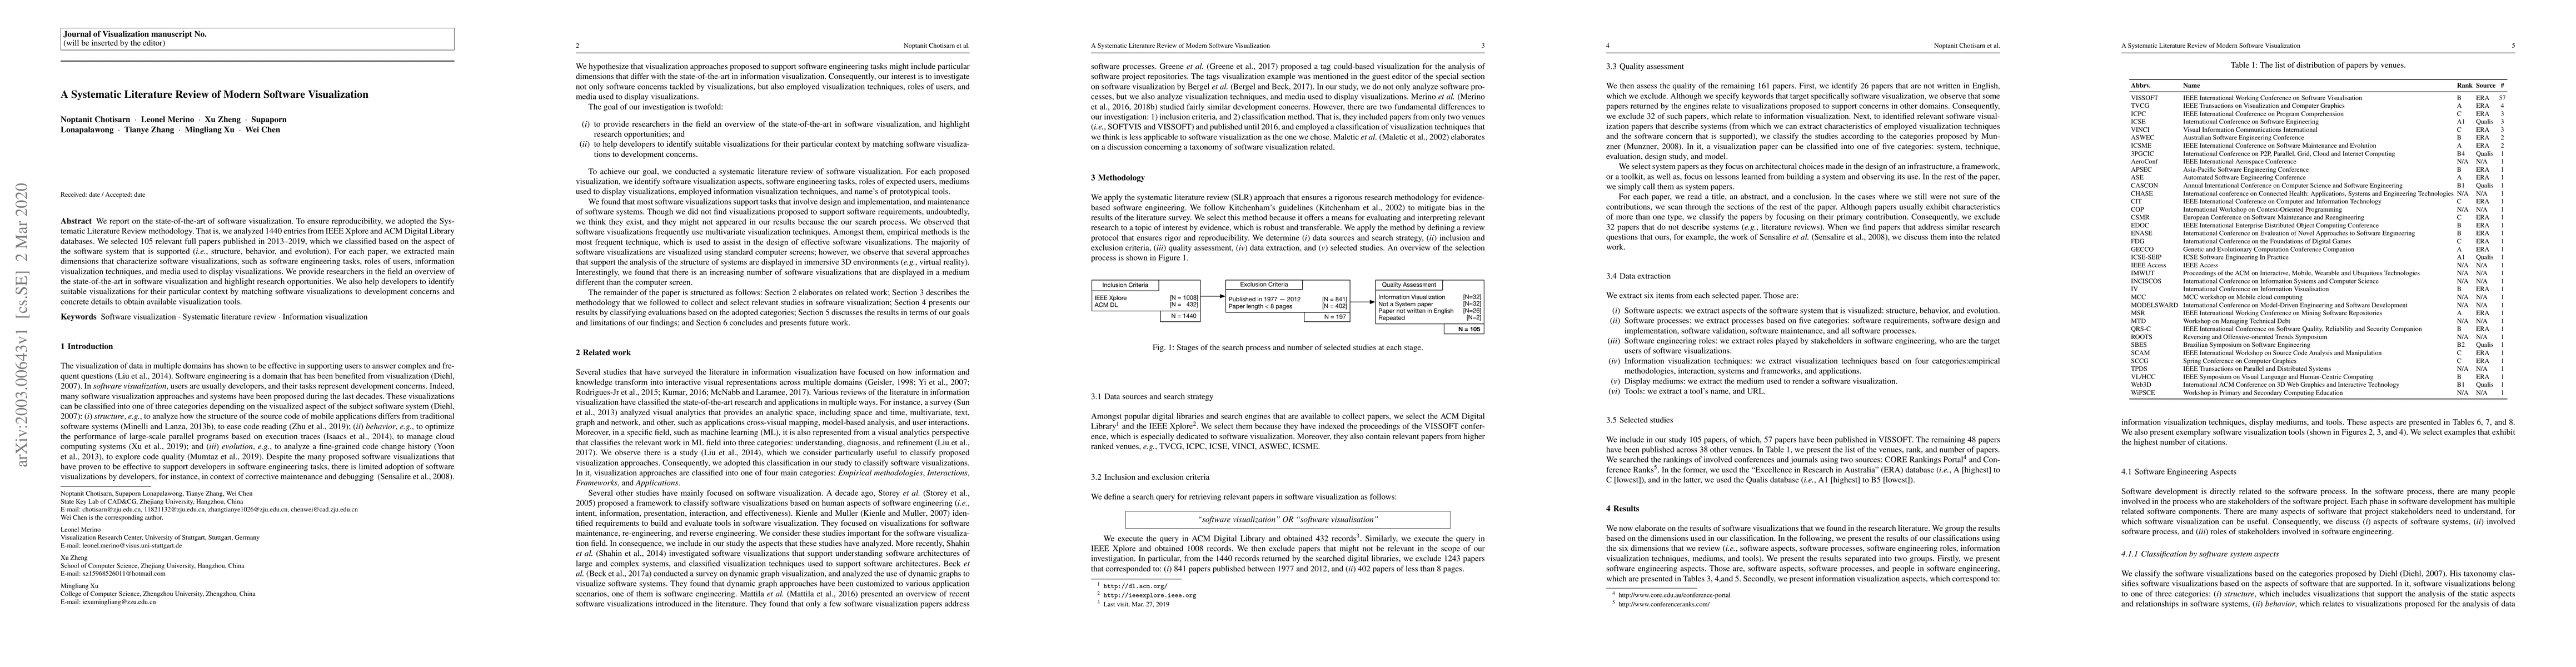
We report on the state-of-the-art of software visualization. To ensure reproducibility, we adopted the Systematic Literature Review methodology. That is, we analyzed 1440 entries from IEEE Xplore and ACM Digital Library databases. We selected 105 relevant full papers published in 2013-2019, which we classified based on the aspect of the software system that is supported (i.e., structure, behavior, and evolution). For each paper, we extracted main dimensions that characterize software visualizations, such as software engineering tasks, roles of users, information visualization techniques, and media used to display visualizations. We provide researchers in the field an overview of the state-of-the-art in software visualization and highlight research opportunities. We also help developers to identify suitable visualizations for their particular context by matching software visualizations to development concerns and concrete details to obtain available visualization tools.
AI Key Findings
Get AI-generated insights about this paper's methodology, results, significance, and more — seven facets brought into focus.
Impact
Paper Details
Authors
PDF Preview
Key Terms
Citation Network
Current paper (gray), citations (green), references (blue)
Display is limited for performance on very large graphs.
Discussion 0