Authors
Summary
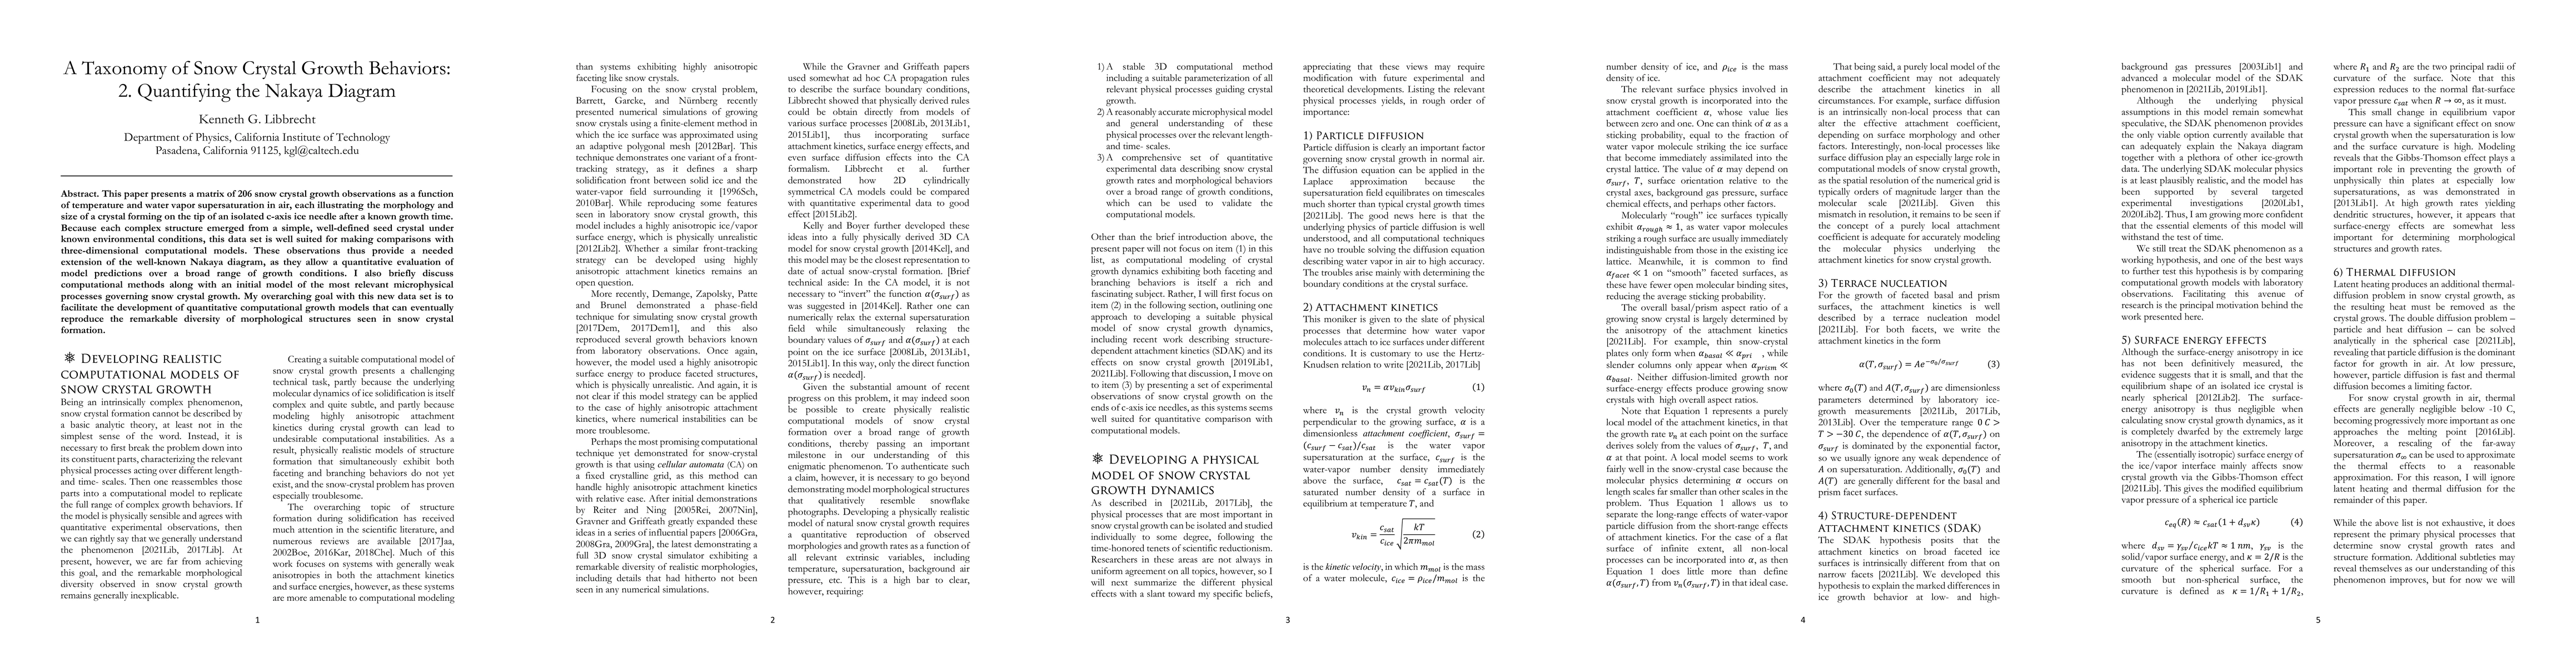
This paper presents a matrix of 206 snow crystal growth observations as a function of temperature and water vapor supersaturation in air, each illustrating the morphology and size of a crystal forming on the tip of an isolated c-axis ice needle after a known growth time. Because each complex structure emerged from a simple, well-defined seed crystal under known environmental conditions, this data set is well suited for making comparisons with three-dimensional computational models. These observations thus provide a needed extension of the well-known Nakaya diagram, as they allow a quantitative evaluation of model predictions over a broad range of growth conditions. I also briefly discuss computational methods along with an initial model of the most relevant microphysical processes governing snow crystal growth. My overarching goal with this new data set is to facilitate the development of quantitative computational growth models that can eventually reproduce the remarkable diversity of morphological structures seen in snow crystal formation.
AI Key Findings
Get AI-generated insights about this paper's methodology, results, and significance.
Paper Details
PDF Preview
Key Terms
Citation Network
Current paper (gray), citations (green), references (blue)
Display is limited for performance on very large graphs.
No citations found for this paper.
Comments (0)