Summary
Over- and undertreatment harm patients and society and confound other healthcare quality measures. Despite a growing body of research covering specific conditions, we lack tools to systematically detect and measure over- and undertreatment in hospitals. We demonstrate a test used to monitor over- and undertreatment in Dutch hospitals, and illustrate its results applied to the aggregated administrative treatment data of 1,836,349 patients at 89 hospitals in 2013. We employ a random effects model to create risk-adjusted funnel plots that account for natural variation among hospitals, allowing us to estimate a measure of overtreatment and undertreatment when hospitals fall outside the control limits. The results of this test are not definitive, findings were discussed with hospitals to improve the model and to enable the hospitals to make informed treatment decisions.
AI Key Findings
Generated Sep 02, 2025
Methodology
The research employs a random effects model to create risk-adjusted funnel plots, analyzing administrative treatment data of 1,836,349 patients across 89 Dutch hospitals in 2013, to detect and measure over- and undertreatment.
Key Results
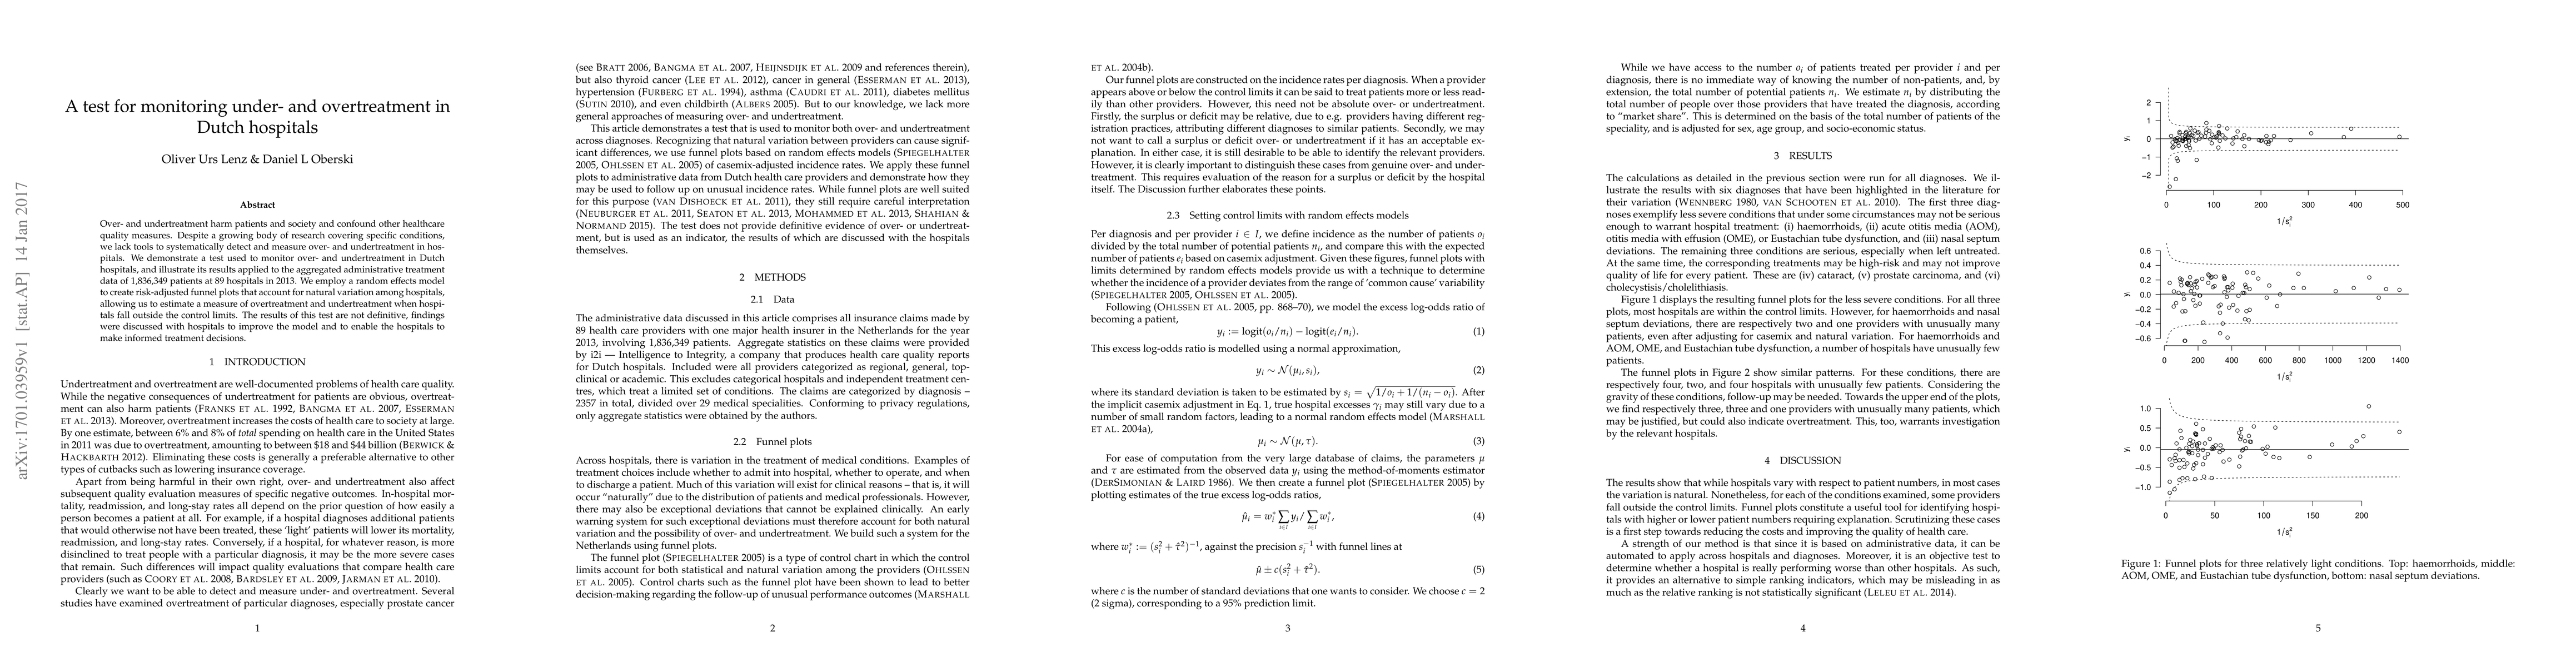
- Funnel plots identified hospitals with unusually high or low patient numbers for specific conditions, indicating potential over- or undertreatment.
- Less severe conditions like hemorrhoids and nasal septum deviations showed some hospitals with unusually many patients, while serious conditions like cataracts, prostate carcinoma, and cholecystisis/cholelithiasis had hospitals with unusually few patients.
- The methodology was applied to six diagnoses highlighted in literature for their variation, demonstrating the tool's ability to pinpoint hospitals requiring further investigation.
Significance
This research is significant as it provides a tool to systematically detect and measure over- and undertreatment in hospitals, which can help reduce healthcare costs and improve quality by enabling informed treatment decisions.
Technical Contribution
The paper introduces a risk-adjusted funnel plot method using a random effects model to analyze administrative data, providing an automated and objective test for hospital performance comparison.
Novelty
This research stands out by offering a systematic approach to detect over- and undertreatment in hospitals using administrative data, which can be automated and applied across hospitals and diagnoses.
Limitations
- The study is based on data from only one health insurer, potentially missing systematic variation across hospitals.
- The method does not detect general over- or undertreatment occurring across all hospitals due to liberal application of diagnostic tools or specific hospital expertise.
- The approach is blind to individual-level under- or overtreatment, which may cancel out at the hospital level.
Future Work
- Future studies could analyze data from all insurers or a random sample of claims to overcome the limitation of using data from a single insurer.
- Investigating mechanisms that might engender general over-(or under-) treatment across hospitals could further refine the method.
Paper Details
PDF Preview
Key Terms
Citation Network
Current paper (gray), citations (green), references (blue)
Display is limited for performance on very large graphs.
Similar Papers
Found 4 papersProvision of key components of palliative care in everyday practice in Dutch hospitals
van Velzen, N., Heipon, C., Boddaert, M. et al.
No citations found for this paper.
Comments (0)