Publication
Metrics
AI Quick Summary
This study analyzes 13 years of multiwavelength data from BL Lacertae, revealing strong variability and several prominent gamma-ray flares. The brightest flare showed a softer-when-brighter trend in X-rays, interpreted as a shift in the synchrotron peak, suggesting the presence of a second emission zone.
Paper Preview
Abstract
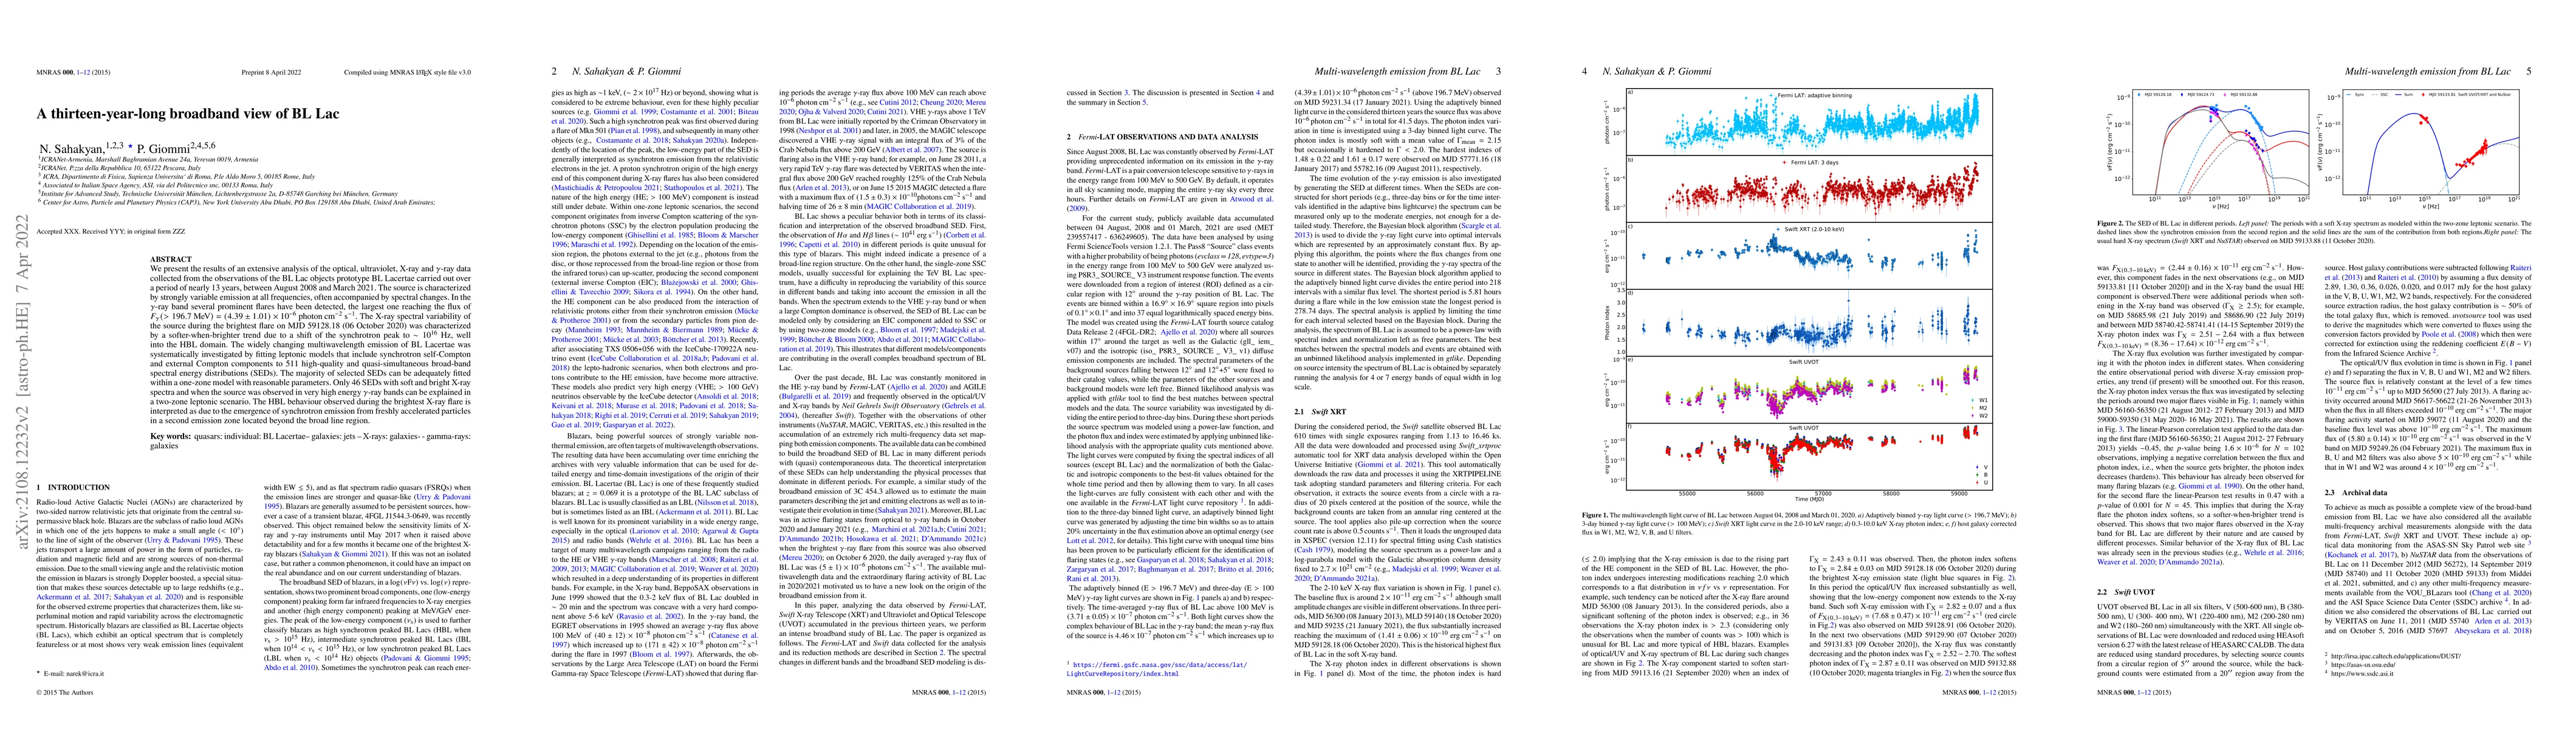
We present the results of an extensive analysis of the optical, ultraviolet, X-ray and $\gamma$-ray data collected from the observations of the BL Lac objects prototype BL Lacertae carried out over a period of nearly 13 years, between August 2008 and March 2021. The source is characterized by strongly variable emission at all frequencies, often accompanied by spectral changes. In the $\gamma$-ray band several prominent flares have been detected, the largest one reaching the flux of $F_{\rm \gamma}(>196.7\: {\rm MeV})=(4.39\pm1.01)\times10^{-6}\:{\rm photon\:cm^{-2}\:s^{-1}}$. The X-ray spectral variability of the source during the brightest flare on MJD 59128.18 (06 October 2020) was characterized by a softer-when-brighter trend due to a shift of the synchrotron peak to $\sim 10^{16}$ Hz, well into the HBL domain. The widely changing multiwavelength emission of BL Lacertae was systematically investigated by fitting leptonic models that include synchrotron self-Compton and external Compton components to 511 high-quality and quasi-simultaneous broad-band spectral energy distributions (SEDs). The majority of selected SEDs can be adequately fitted within a one-zone model with reasonable parameters. Only 46 SEDs with soft and bright X-ray spectra and when the source was observed in very high energy $\gamma$-ray bands can be explained in a two-zone leptonic scenario. The HBL behaviour observed during the brightest X-ray flare is interpreted as due to the emergence of synchrotron emission from freshly accelerated particles in a second emission zone located beyond the broad line region.
AI Key Findings
Get AI-generated insights about this paper's methodology, results, significance, and more — seven facets brought into focus.
Impact
Paper Details
Authors
PDF Preview
Key Terms
Citation Network
Current paper (gray), citations (green), references (blue)
Display is limited for performance on very large graphs.
Related Papers
No references found for this paper.
Discussion 0